Abstract
Purpose
The aim of the study was to investigate if axial T1ρ MR images had similar accuracy as established sagittal T1ρ MRI for the assessment of proteoglycan concentration and content in intervertebral degenerated discs (IDDs).
Methods
T1ρ and T2-weighted MR images of 12 intervertebral discs (IVDs) from 3 harvested human lumbar spines (levels L1–L2 to L5–S1) were grouped across their degenerative grade (Pfirrmann scores) and analyzed using a 3T MRI scanner in the axial and sagittal views. Post-processing of axial T1ρ-weighted images was performed using a Wiener filter. Median axial T1ρ values for traced regions of interest (ROIs) on color maps were compared against ROIs in the corresponding location in the sagittal plane of each disc. Assessment of sulfated glycosaminoglycans (GAGs) content was also performed.
Results
Comparison of post Wiener filtered mid-axial T1ρ values in the NP with corresponding mid-sagittal values revealed no statistical difference (P > 0.05). Higher axial T1ρ and biochemically measured GAGs content corresponded to a lower Pfirrmann grading of the IVDs. A strong association between the T1ρ values and the GAG contents was observed (r = 0.85, P = 0.0002).
Conclusions
The axial T1ρ methodology was validated against sagittal T1ρ providing an augmented spatial representation of IVD and can facilitate localization of focal degeneration within IVDs. T1ρ values provided a better granularity assessment of degenerative disc disease as it correlated with proteoglycan concentration. Thus, Wiener filtering is an effective tool for removing noise from T1ρ-weighted axial MR images.
Keywords: Intervertebral disc (IVD), Axial T1ρ, magnetic resonance imaging (MRI), Wiener filtering, Proteoglycan, Pfirrmann grade
Introduction
Current diagnostic modalities for human intervertebral discs (IVDs) are not able to diagnose the advent of early intervertebral disc degeneration (IDD), nor provide a quantitative assessment of its biochemical composition. Conventional magnetic resonance imaging (MRI) is useful for evaluating IDD but is often only sensitive to late-stage morphological changes in the IVD. As such there is a desire in the clinical community for a diagnostic tool that would better reflect physiological status of the IVD and quantifying IDD [1].
Recently, T1ρ-weighted MRI has emerged as a potential non-invasive physiological diagnostic tool for studying early IDD [2]. This MRI sequence produces color maps associated with a T1ρ time constant derived from spin-lock MRI and spin–lattice relaxation in the rotating frame; known as T1ρ relaxation [3]. T1ρ time constants are calculated from decay constants of exponential curves, which are fitted to T1ρ relaxation times plotted over the spin-lock pulse durations. The process is performed for each pixel in the MR image matrix and a T1ρ map is created by superimposing each calculated T1ρ time constant onto each pixel in the original T1-weighted images. An appropriate color map is then selected based on the amplitude of each T1ρ value to form the T1ρ color map. Knowing that IDD is hallmarked by a loss of proteoglycans in its nucleus pulposus (NP) [4], if an imaging modality could quantify the proteoglycan concentration, early IDD could be diagnosed and early management could be initiated. Axial T1ρ imaging would be ideal for this but it has not been successfully implemented and validated due to high noise and excessively grainy images that are inadequate for diagnostic purposes [5].
The aim of this study was to demonstrate a method for acquiring high quality and robust axial T1ρ MR images and to demonstrate that these images are as reliable as corresponding sagittal T1ρ MR images. The second aim was to confirm that T1ρ values, both axial and sagittal are associated with the variation in proteoglycan concentration across disease discs as per Pfirrmann grade. The clinical relevance of these axial images remains to be demonstrated and our belief is that this imaging modality will allow to localize foci of degeneration found in the early degenerative disc process.
Materials and methods
Study sample
The study samples came from 3 donors; 1 male and two females aged 26, 44, and 53, respectively. The donated lumbar spines were harvested by McGill Scoliosis and Spinal Research group, Transplant Quebec the provincial organ donation program, with the approval of McGill’s University IRB. Inclusion criteria for each donor consisted of: no prior history of back surgery, spinal trauma, no metabolic disease, and no deformity. T1ρ and T2-weighted MRIs were acquired for each spine in the axial and sagittal views immediately after spine extraction using a 3T MRI research scanner. A total of 15 discs from levels L1–L2 to L5–S1 were graded using the Pfirrmann grading system [6] on sagittal T2-weighted MR images (grade 2 1 2 1 2, 3 2 3 3 1, 2 3 2 2 4 respectively). Due to the saturation band in the MRI scanner set too close to the L5–S1, these could not be used. Hence a total of 12 IVDs from levels L1–L5 were included in the analysis.
MRI acquisition
MRIs were obtained with each lumbar spine placed in a SENSE 8 channel head coil to compensate for missing adjacent tissue to obtain a better Signal to Noise Ratio (SNR) rather than using the spine array coil, which is more appropriate for in vivo studies. Standard MRIs were acquired using a Siemens 3T TimTrio clinical scanner (Siemens Medical Solutions). Both the sagittal and axial T1ρ-weighted images were acquired as per the published protocol by Borthakur et al. [14]. A series of images were acquired with five spin-lock times (TSL) from 5 to 40 ms. Sagittal plane slices consisted of 24 slices across the entire spine from left to right with 3 mm slice thickness, while axial plane slices consisted of 8 slices per disc with thickness of 1.5 mm. Other parameters were: TE/TR/flip angle = 3 ms/6 ms/20°, FOV = 20 × 20 cm, acquisition matrix = 256 × 128 × 16, interpolated to 256 × 256 × 16, in-plane resolution = 0.8 × 0.8 mm2, BW = 130 Hz/pixel, centric k-space encoding and the spin-locking frequency was fixed at 500 Hz. Total imaging time was under 20 min. T2 MRI was performed for Pfirrmann grading of the same slice locations as T1ρ MRI with a turbo spin-echo (TSE) pulse sequence with the following parameters: FOV = 20 × 20 cm; slice thickness = 3 mm; acquisition matrix = 256 × 256; and TE/TR = 127/4,320 ms.
Processing to obtain T1ρ color maps
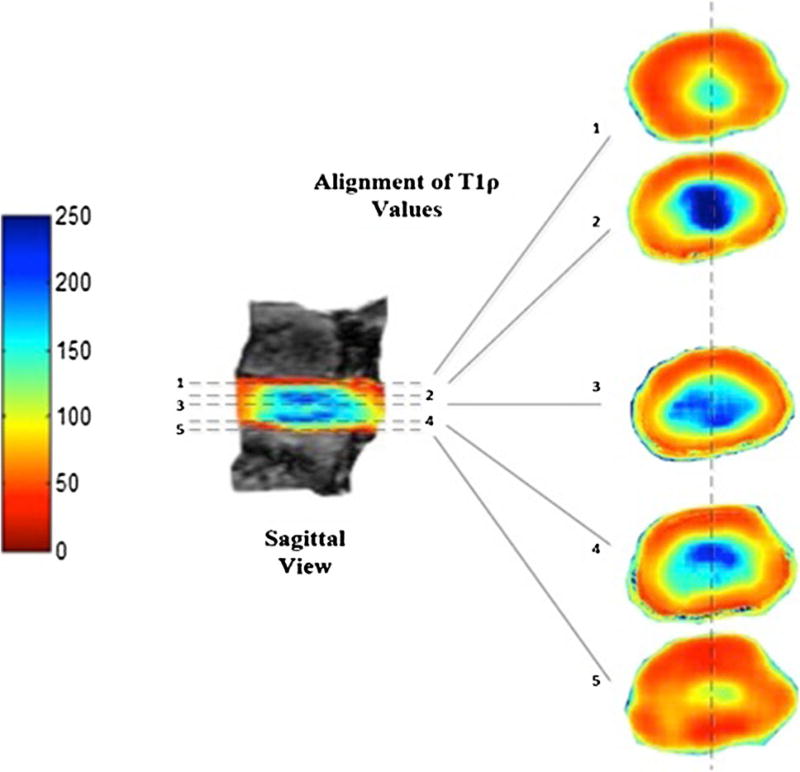
All post image processing and filtering were performed using custom-written software in Matlab (Natick, MA) [7]. A total of 24 sagittal and 8 axial T1ρ images per disc were obtained. A global color scale was associated to the respective time constant based on its value over all of the range of time constants in the image, reflecting T1ρ values in milliseconds. Such broad values provided a true scale across the anatomic variation of the IVD. The inner and outer annuluses as well as the consistency of the nucleus were heightened allowing better visualisation (Fig. 1).
Fig. 1.
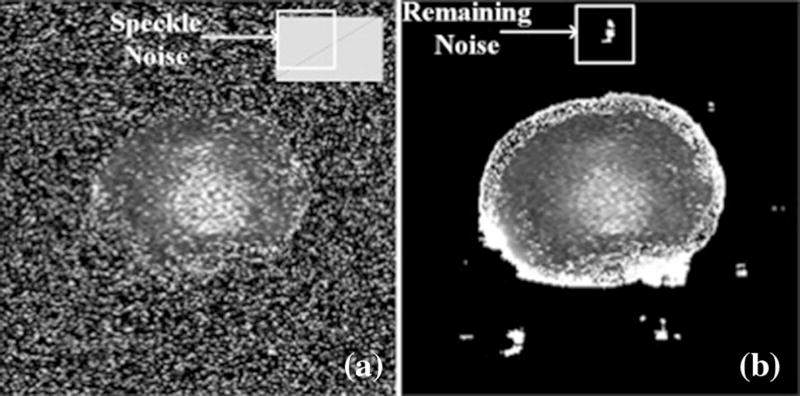
Raw mid-axial image of a L1–L2 intervertebral disc (IVD) obtained from a 26-year-old donor pre-filtered (a) and post-processed using a Wiener filter (b)
Axial T1ρ and de-noising
Post imaging acquisition manipulation of the acquired axial T1ρ images was required due to low Signal-to-Noise Ratios (SNRs). In contrast to the sagittal T1ρ, the axial cross section of the explanted spine is small in relationship to the space annex to the spine leading to an increase in background noise. To rectify this, we applied an established algorithmic process used in medical imaging: Wiener filtering [8]. It consists of defining focal pixel values based on its neighbouring pixel values specifically looking at the local mean and local variance of each neighbouring pixel. These “Neighbourhoods” are matrices that represent constant windows, which are applied over the entire image. Wiener filters adapt to each windowed section images and the de-noising process is therefore not constant, which increases selectivity compared to linear filtering [9]. This allows the preservation of edges and other high-frequency parts of an image. The net effect is that for areas of small variances, the Wiener filters perform more of a smoothing process, while for larger variances it heightens differences. Specific to the IVD, the process preserves edges, as it is important for demarcation between the NP, annulus fibrous (AF), and remaining bone in the axial MRI slices.
T1ρ value selection using ROIs
After filtering, T1ρ were calculated for all the axial slices. The mid-axial slice (slice number 5 of 8, representing the centre of the disc) was selected. The T1ρ images were manually cropped by a single user (K.R.M.) around the perimeter of the IVD and superimposed onto the original T1-weighted images. A circular ROI of 8 mm in diameter was positioned in the centre of the NP in the T1ρ maps based on photographs of the original specimens. The median of the T1ρ time constants was calculated within the ROI for each IVD and stored. The mid-sagittal slices were processed in the same way as the mid-axial slices to obtain median T1ρ time constants in the NP of the sagittal plane.
Measuring proteoglycan concentration in the IVDs
After the MRI was done, an 8 mm diameter tissue core was excised, matching the exact location of the defined ROI that calculated the T1ρ values. From this core, the middle third was isolated corresponding to the NP (center–center on the axial and sagittal discs). Proteins were extracted at 4 °C under continuous agitation for 48 h on a wet weight per volume basis using a 15 volume extraction buffer (4 M guanidinium chloride, 50 mM sodium acetate, pH 5.8, 10 mM EDTA, COMPLEAT® proteinase inhibitors (Roche), and centrifuged at 16,000g for 30 min. Sulfated glycosaminoglycans (GAGs) were stained and quantified with a modified dimethylmethylene blue (DMMB) dye-binding assay [10].
Statistical analysis
Median T1ρ time constants from circular ROIs that are defined in the mid NP region of each IVD obtained from T1ρ axial maps were compared to their sagittal counterparts using the non-parametric Mann–Whitney test and a significance level of alpha <0.05 was considered. This was applied for each mid-NP axial and sagittal pair for each of the 12 IVDs. To further confirm similarity, each axial and sagittal mid-NP pairs were plotted against one another and a regression analysis was performed. A Spearman correlation was performed to identify the relationship between the T1ρ time constants and the GAGs content within each disc. Data were analysed using Prism (GraphPad Software Inc, San Diego, California).
Results
Effect of using a Wiener filter
Prior to the use of filtering, the mid-axial slice was visually separated from the background but covered by speckle noise (Fig. 1a). By estimating an average variance of 10 µs2 in the noise using a sample of the image outside of the IVD area, a Wiener filter was applied (Fig. 1b). The filtered images showed some remains of noise in the background and around the outer annulus fibrosus (AF). Inside the AF perimeter, speckle noise was drastically reduced. The NP was visually distinguishable from the AF with no apparent smoothing induced by the filter process.
Applying T1ρ color maps
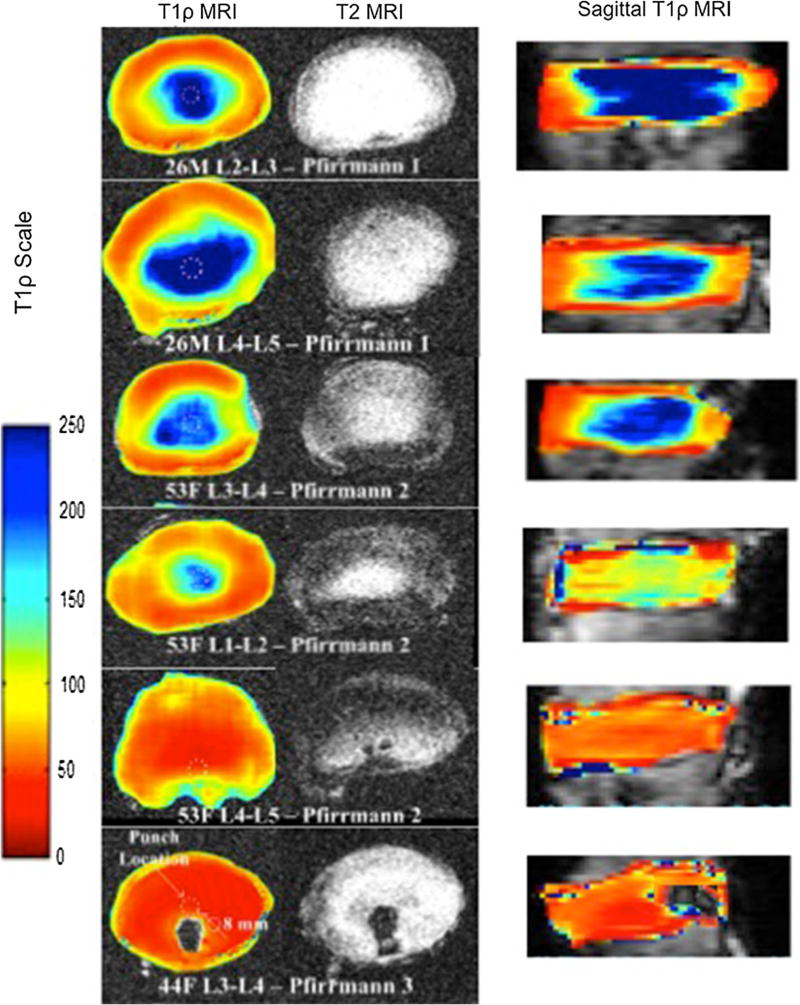
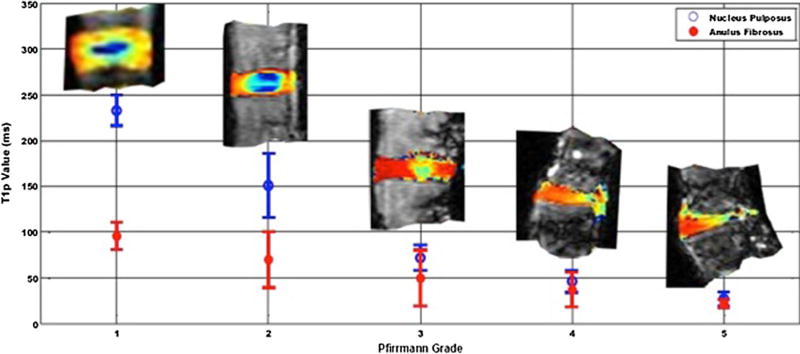
The anatomical morphology across the IVDs was better delineated using the T1ρ sequence, as the annulus were well-defined while the nucleus was even more circumscribed (Fig. 2). Morphological differences were visible of the nucleus between different levels on axial T1ρ despite discs being graded similarly (Fig. 3). T1ρ visually provided a better scaling of the degeneration than the Pfirrmann grading. The axial T1ρ images illustrated that as the disc demonstrated signs of degeneration, the nucleus and annulus homogenized in their appearance previously described morphological changes [11].
Fig. 2.
Representative examples of mid-axial and corresponding sagittal T1ρ images across age and severity of degeneration as classified by Pfirrmann grading intervertebral disc. The dashed circles indicate where the biopsy punches were performed for assessing proteoglycan concentrations in the NP
Fig. 3.
Average T1ρ values (ms) of the nucleus pulposus for each Pfirrmann grading of 9 IVDs. T1ρ value for Pfirrmann grade 2 varies both in its overall value but also in the morphological representation of the disc
Validation of axial T1ρ values
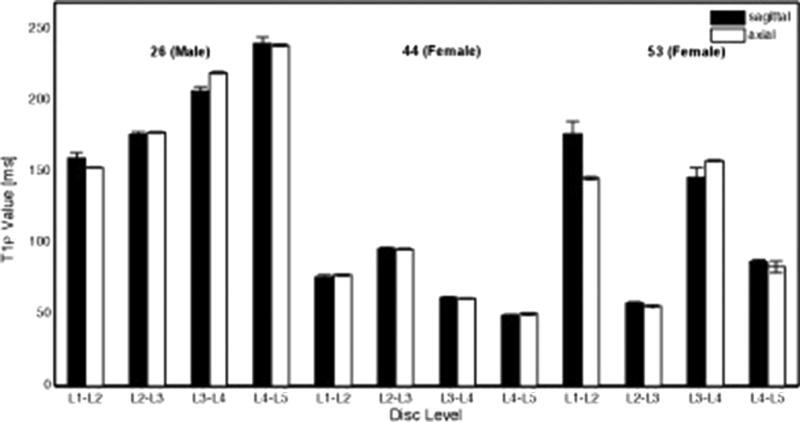
The highest and lowest T1ρ values in the axial and sagittal cases were 238.7 and 240.1 ms and 49.0 and 50.6 ms, respectively, demonstrating no differences between the two planes and confirming similarity (r2 = 0.972, P > 0.05) (Fig. 4). Vertical coronal slices (1–7) through the sagittal T1ρ maps revealed that the corresponding axial color maps were equivalent (Fig. 5).
Fig. 4.
Measured T1ρ values from region of interests (ROIs) in the nucleus pulposus plotted over L1–L2 to L5–S1 disc levels from sagittal and axial mid-axial images for 26, 44 and 53-year-old male and female donors. Comparison between the axial and sagittal T1ρ values of each intervertebral disc revealed no differences (P = 0.35). Furthermore, a plot of the acquired values of the axial and sagittal images revealed great similarities (r2 = 0.972)
Fig. 5.
Demonstration of corresponding sagittal and axial T1ρ values
Comparison of T1ρ with proteoglycan concentrations
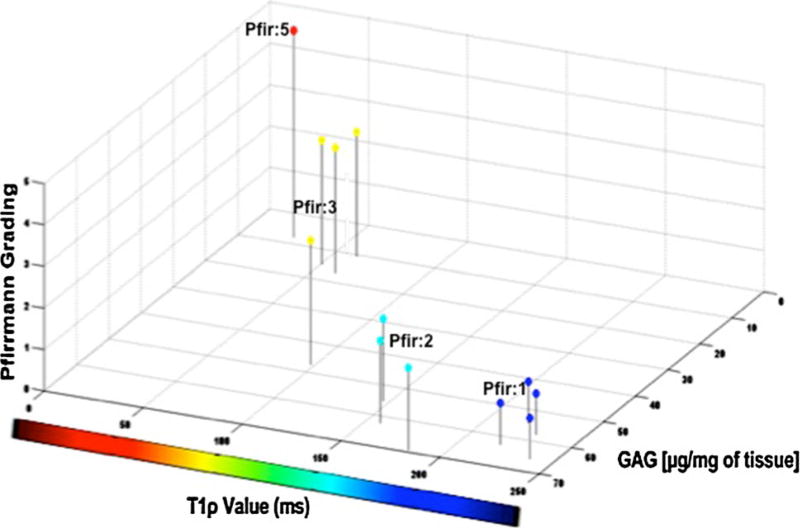
Proteoglycan concentration values were plotted against the respective T1ρ values and Pfirrmann grades for each IVD (Fig. 6). High GAG content was associated with high T1ρ time constants (r = 0.85, P = 0.0002). As T1ρ decreased, so did the GAG content. Similarly, as the T1ρ dropped the Pfirrmann grade increased. Of note, high T1ρ were recorded in both young and old discs (26 and 53 year old donors) in healthy looking disc graded as Pfirrmann 1. This was reflected by higher values in the NP region of the mid-axial MR image slices. The low GAG content for the 44-year-old donor reflected low T1ρ values in the NP region of the mid-axial MR image slices and an overall higher Pfirrmann grade. The average T1ρ values for a Pfirrmann grade 1, 2, 3 and 5 were 229.1 ± 9.7, 135.5 ± 15.2, 61.3 ± 5.8, and 24.6 ms. The average GAG contents for a Pfirrmann grade 1, 2, 3 and 5 were 60.15 ± 7.87, 58.84 ± 5.28, 23.16 ± 3.39 and 7.78 normalized µg/mg of healthy tissue, respectively.
Fig. 6.
3D illustration of the association between T1ρ value, Pfirrmann grade and the glycosaminoglycan (GAG) content for the 12 IVDs. The higher the GAG content is, the higher is the T1ρ value and lower is the Pfirmann grade
Discussion
Conventional MRI detects morphological changes in disc height and hydration [12] but is insensitive to early biochemical changes in the disc [13]. [14] Prior classification system has been qualitative, susceptible to observer bias, and non-specific for disc sub-structures. Sagittal T1ρ, as described by Borthakur et al. [15], provides some physiological insight into the IVD. In their crude form, the axial T1ρ images are of poor quality and negate all the benefits of topographical axial views. Noise filtering in medical imaging is not new as linear average, and Wiener filters have been used in ultrasound [16] and MRI [17]. The Wiener filter produces the best results in edge preservation and noise reduction. The results from the current study suggest that axial T1ρ imaging represents an improvement to sagittal T1ρ specifically for IVDs. The results confirm that the axial T1ρ methodology is as valid as sagittal T1ρ as a quantitative measure of overall health of an IVD. Moreover, the axial T1ρ images of healthy IVDs showed clearer distinct separation between the NP and the AF, which was not as clear in T2-weighted images.
Other groups are also attempting to better define disc morphology and biochemical composition. Axial sodium MRIs have been performed allowing the creation of axial color maps similar to our axial T1ρ color maps [18]. The signal intensity of the pixel values in the sodium color maps have been shown to correlate significantly with proteoglycan concentrations in the IVD similar to what we have demonstrated in the present study. However, disadvantages to sodium MRI imaging include inherently low SNRs and the requirement of a special broadband radio frequency transmitter/receiver. Using axial T1ρ and the filtering proposed here, good SNRs are demonstrated without requiring additional equipment. These advantages are sufficient to make T1ρ with the use of Wiener filtering the method of choice for assessing the health of IVDs [19].
Similar to the study of Wang et al. [18], our results demonstrated that proteoglycan concentrations are proportional to T1ρ MRI values in both sagittal and axial planes and infer that proteoglycan concentrations equalize across the annulus and nucleus with degeneration. It is thought that there is not a sudden escape of proteoglycan from the NP with degeneration but a mere redistribution outside of the NP into the AF [20]. An association between T1ρ and GAG measurements to respective Pfirrmann grades for each IVD was demonstrated in this study. The results showed that higher T1ρ and GAG measurements corresponded to lower Pfirrmann grades. Notably, variability exists for T1ρ and GAG measurements describing Pfirrmann grades 1, 2 and 3. This alludes to the fact that a superiority and inferiority exists between IVDs classified under the same Pfirrmann grade, and thus T1ρ may be a better metric for IVD assessment and evaluation. The average T1ρ values for a Pfirrmann grade 1, 2, 3 and 5 were 229.1 ± 9.7, 135.5 ± 15.2, 61.3 ± 5.8, and 24.6 ms. Therefore, in order for a disc to be classified as healthy, the T1ρ should be around 230 ms. Similar normative values were reported by Zobel et al. [2] who compared T1ρ measurements to the Pfirrmann grade. In our study, the average GAG contents for a Pfirrmann grade 1, 2, 3 and 5 were 60.15 ± 7.87, 58.84 ± 5.28, 2.75 ± 3.39, and 7.78 normalized µg/mg of healthy tissue. In order for a disc to be classified as healthy, the GAG should be about 60 normalized µg/mg of healthy tissue. It is believed that the wide range of GAG and T1ρ in each Pfirrmann grade collaborates with the idea that T1ρ can be used as a diagnostic tool to identify IDD. The ability to non-invasively image the disc using axial T1ρ provides further insights into IDD and the decline in proteoglycan can now potentially be followed in detail in live subjects. Adding axial images to sagittal images provides a detailed three-dimensional map of the disc.
In conclusion, acquisition of axial T1ρ is optimized by the Wiener filtering and validated against sagittal T1ρ for better assessing IDD. Pfirmann grading poorly differentiates early degenerative disc disease while T1ρ provides a broader spectrum in quantifying IDD. Obtaining topographical views of IVDs allows identification of focal areas of degeneration.
Acknowledgments
The authors thank Matthew Fenty for sagittal T1ρ imaging training, Yi Wen Shao for assessment of GAG content, Dr. Peter Jarzem for providing samples, Dr. Thomas Stefen for technical support and Dr. Bruce Pike for MRI access. This work was funded by AOSpine SRN 02/103, CIHR MOP-119564 and the McGill Scoliosis and Spinal Research Chair.
Conflict of interest Our institution receives funding from the AONA for fellowship funding and funds from AO Foundation for research. The corresponding author sits on the Technical Commission for spinal deformity and is a consultant for Depuy Synthese.
Contributor Information
Kyle R. Mulligan, Orthopedics Research Laboratory of McGill University, Montreal General Hospital, 687 Pine Avenue West Suite L-4.65, Montreal, QC H3A 1A1, Canada McGill Scoliosis and Spine Group, Montreal General Hospital, 1650 Cedar Avenue Office B5-158.4, Montreal, QC H3G 1A4, Canada.
Catherine E. Ferland, McGill Scoliosis and Spine Group, Montreal General Hospital, 1650 Cedar Avenue Office B5-158.4, Montreal, QC H3G 1A4, Canada Scoliosis and Spine Centre, Montreal Children Hospital, McGill University Health Centre, 2300 Tupper, C521, Montreal H3H 2B1, Canada.
Rahul Gawri, Orthopedics Research Laboratory of McGill University, Montreal General Hospital, 687 Pine Avenue West Suite L-4.65, Montreal, QC H3A 1A1, Canada; McGill Scoliosis and Spine Group, Montreal General Hospital, 1650 Cedar Avenue Office B5-158.4, Montreal, QC H3G 1A4, Canada.
Arijitt Borthakur, Department of Radiology, Center for Magnetic Resonance and Optical Imaging, University of Pennsylvania, B1 Stellar-Chance Laboratories, 422 Curie Blvd, Philadelphia, PA 19104, USA.
Lisbet Haglund, Orthopedics Research Laboratory of McGill University, Montreal General Hospital, 687 Pine Avenue West Suite L-4.65, Montreal, QC H3A 1A1, Canada; McGill Scoliosis and Spine Group, Montreal General Hospital, 1650 Cedar Avenue Office B5-158.4, Montreal, QC H3G 1A4, Canada.
Jean A. Ouellet, Email: jean.ouellet@muhc.mcgill.ca, Orthopedics Research Laboratory of McGill University, Montreal General Hospital, 687 Pine Avenue West Suite L-4.65, Montreal, QC H3A 1A1, Canada; McGill Scoliosis and Spine Group, Montreal General Hospital, 1650 Cedar Avenue Office B5-158.4, Montreal, QC H3G 1A4, Canada; Scoliosis and Spine Centre, Montreal Children Hospital, McGill University Health Centre, 2300 Tupper, C521, Montreal H3H 2B1, Canada.
References
- 1.Palepu V, Kodigudla M, Goel VK. Biomechanics of disc degeneration. Adv Orthop. 2012;2012:726210. doi: 10.1155/2012/726210. [DOI] [PMC free article] [PubMed] [Google Scholar]
- 2.Zobel BB, Vadala G, Del Vescovo R, Battisti S, Martina FM, Stellato L, Leoncini E, Borthakur A, Denaro V. T1rho magnetic resonance imaging quantification of early lumbar intervertebral disc degeneration in healthy young adults. Spine. 2012;37(14):1224–1230. doi: 10.1097/BRS.0b013e31824b2450. [DOI] [PMC free article] [PubMed] [Google Scholar]
- 3.Beattie PF, Meyers SP. Magnetic resonance imaging in low back pain: general principles and clinical issues. Phys Ther. 1998;78(7):738–753. doi: 10.1093/ptj/78.7.738. [DOI] [PubMed] [Google Scholar]
- 4.Antoniou J, Steffen T, Nelson F, Winterbottom N, Hollander AP, Poole RA, Aebi M, Alini M. The human lumbar intervertebral disc: evidence for changes in the biosynthesis and denaturation of the extracellular matrix with growth, maturation, ageing, and degeneration. J Clin Investig. 1996;98(4):996–1003. doi: 10.1172/JCI118884. [DOI] [PMC free article] [PubMed] [Google Scholar]
- 5.Keshari KR, Zektzer AS, Swanson MG, Majumdar S, Lotz JC, Kurhanewicz J. Characterization of intervertebral disc degeneration by high-resolution magic angle spinning (HR-MAS) spectroscopy. Magn Reson Med Off J Soc Magn Reson Med Soc Magn Reson Med. 2005;53(3):519–527. doi: 10.1002/mrm.20392. [DOI] [PubMed] [Google Scholar]
- 6.Pfirrmann CW, Metzdorf A, Zanetti M, Hodler J, Boos N. Magnetic resonance classification of lumbar intervertebral disc degeneration. Spine. 2001;26(17):1873–1878. doi: 10.1097/00007632-200109010-00011. [DOI] [PubMed] [Google Scholar]
- 7.Mathworks. MATLAB—the language for technical computing 2013 [Google Scholar]
- 8.Schlueter FJ, Wang G, Hsieh PS, Brink JA, Balfe DM, Vannier MW. Longitudinal image deblurring in spiral CT. Radiology. 1994;193(2):413–418. doi: 10.1148/radiology.193.2.7972755. [DOI] [PubMed] [Google Scholar]
- 9.Pham QD, Kusumi Y, Hasegawa S, Hayasaki Y. Digital holographic microscope with low-frequency attenuation filter for position measurement of a nanoparticle. Opt Lett. 2012;37(19):4119–4121. doi: 10.1364/OL.37.004119. [DOI] [PubMed] [Google Scholar]
- 10.Barbosa I, Garcia S, Barbier-Chassefiere V, Caruelle JP, Martelly I, Papy-Garcia D. Improved and simple micro assay for sulfated glycosaminoglycans quantification in biological extracts and its use in skin and muscle tissue studies. Glycobiology. 2003;13(9):647–653. doi: 10.1093/glycob/cwg082. [DOI] [PubMed] [Google Scholar]
- 11.Guiot BH, Fessler RG. Molecular biology of degenerative disc disease. Neurosurgery. 2000;47(5):1034–1040. doi: 10.1097/00006123-200011000-00003. [DOI] [PubMed] [Google Scholar]
- 12.Gunzburg R, Fraser RD, Moore R, Vernon-Roberts B. An experimental study comparing percutaneous discectomy with chemonucleolysis. Spine. 1993;18(2):218–226. doi: 10.1097/00007632-199302000-00008. [DOI] [PubMed] [Google Scholar]
- 13.Luoma K, Vehmas T, Riihimaki H, Raininko R. Disc height and signal intensity of the nucleus pulposus on magnetic resonance imaging as indicators of lumbar disc degeneration. Spine. 2001;26(6):680–686. doi: 10.1097/00007632-200103150-00026. [DOI] [PubMed] [Google Scholar]
- 14.Kettler A, Wilke HJ. Review of existing grading systems for cervical or lumbar disc and facet joint degeneration. Eur Spine J Off Publ Eur Spine Soc Eur Spinal Deform Soc Eur Sect Cervic Spine Res Soc. 2006;15(6):705–718. doi: 10.1007/s00586-005-0954-y. [DOI] [PMC free article] [PubMed] [Google Scholar]
- 15.Borthakur A, Maurer PM, Fenty M, Wang C, Berger R, Yoder J, Balderston RA, Elliott DM. T1rho magnetic resonance imaging and discography pressure as novel biomarkers for disc degeneration and low back pain. Spine. 2011;36(25):2190–2196. doi: 10.1097/BRS.0b013e31820287bf. [DOI] [PMC free article] [PubMed] [Google Scholar]
- 16.Zain MLBM, Elamvazuthi I, Begam M. Enhancement of bone fracture image using filtering techniques. J Video Image Process. 2009;9(10):33–37. [Google Scholar]
- 17.Martin-Fernandez M, Alberola-Lopez C, Ruiz-Alzola J, Westin CF. Sequential anisotropic Wiener filtering applied to 3D MRI data. Magn Reson Imaging. 2007;25(2):278–292. doi: 10.1016/j.mri.2006.05.001. [DOI] [PubMed] [Google Scholar]
- 18.Wang C, McArdle E, Fenty M, Witschey W, Elliott M, Sochor M, Reddy R, Borthakur A. Validation of sodium magnetic resonance imaging of intervertebral disc. Spine. 2010;35(5):505–510. doi: 10.1097/BRS.0b013e3181b32d3b. [DOI] [PMC free article] [PubMed] [Google Scholar]
- 19.Haglund L, Moir J, Beckman L, Mulligan KR, Jim B, Ouellet JA, Roughley P, Steffen T. Development of a bioreactor for axially loaded intervertebral disc organ culture. Tissue Eng Part C Methods. 2011;17(10):1011–1019. doi: 10.1089/ten.TEC.2011.0025. [DOI] [PubMed] [Google Scholar]
- 20.Singh K, Masuda K, Thonar EJ, An HS, Cs-Szabo G. Age-related changes in the extracellular matrix of nucleus pulposus and anulus fibrosus of human intervertebral disc. Spine. 2009;34(1):10–16. doi: 10.1097/BRS.0b013e31818e5ddd. [DOI] [PMC free article] [PubMed] [Google Scholar]


