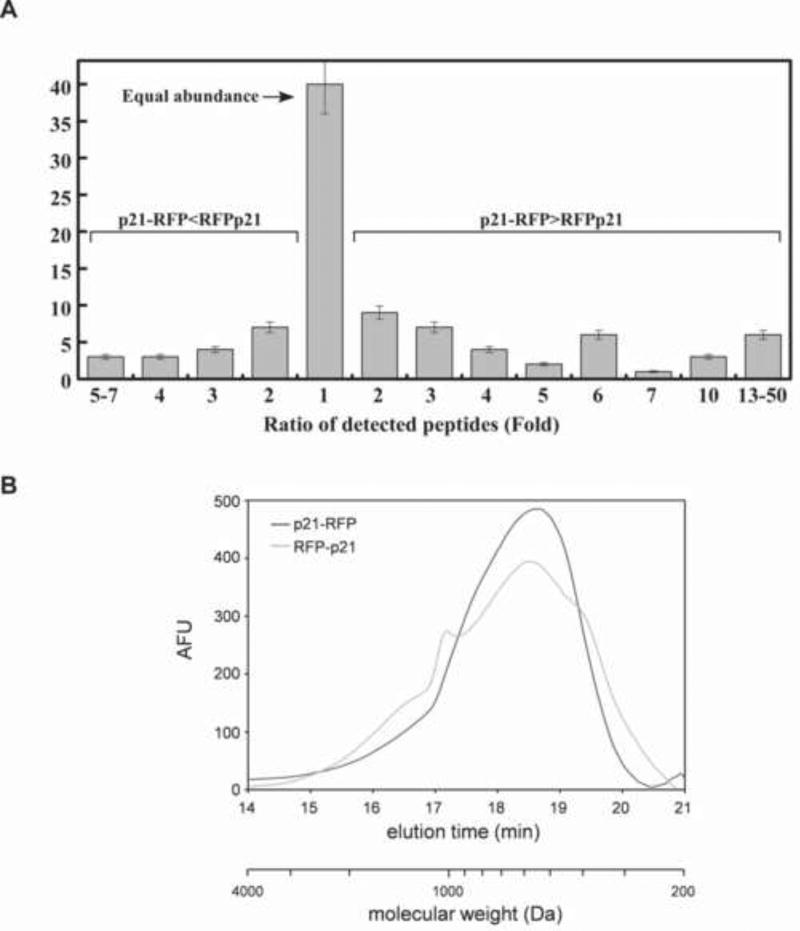
Figure 5.
(A) The 26S proteasome generated different spectrum of peptides from p21 upon degradation from its N or C-terminus and much greater diversity in the N to C direction. Following digestion of RFP-p21 and p21-RFP by 26S proteasomes, equal amounts of the degradation products (as estimated by fluorescamine) were analyzed by MS. Prior to the analysis one set of peptides was labeled by reductive dimethylation with deuterium-and 13C, ‘heavy’, formaldehyde and the other set treated with non-isotopic formaldehyde. The samples were mixed, and the isotopic ratios in the individual peptides were analyzed by mass spectrometry. These experiments were repeated three times with standard deviations of less than 10%. The raw data of both analyses is presented in Figure S4. (B) Size distribution of peptides generated from p21-RFP and RFP-p21. Peptides generated during degradation of p21-RFP and RFP-p21 by 20S (without SDS activation) and 26S proteasomes were separated from undigested protein by ultrafiltration through a 10kDa cutoff membrane. Equal amounts of peptide products were reacted with fluorescamine and immediately fractionated on a high-performance size exclusion column. The fluorescence of eluted material was monitored continuously with a fluorescence detector and a blank run (corresponding to time 0) was always subtracted. Molecular weights were calculated from the calibration curve shown in Figure S6. Similar data were obtained in at least four independent experiments.

