Fig. 3.

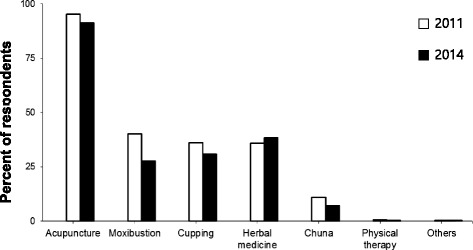
Changes in the usage of KM therapies between 2011 and 2014. The graph shows the changes over time in the patterns of various therapies received in KM clinics. The 2011 survey data were obtained from Woo et al. [11]

Changes in the usage of KM therapies between 2011 and 2014. The graph shows the changes over time in the patterns of various therapies received in KM clinics. The 2011 survey data were obtained from Woo et al. [11]