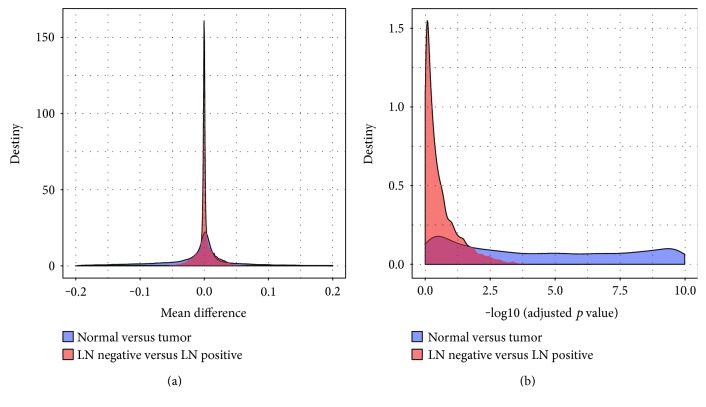
Figure 1.
The density of the mean difference and BH-adjusted p value of the two comparisons. (a) The density of the mean difference of normal versus cancer comparison and LN negative versus LN positive comparison. (b) The density of the log10 BH-adjusted p value of normal versus cancer comparison and LN negative versus LN positive comparison.

