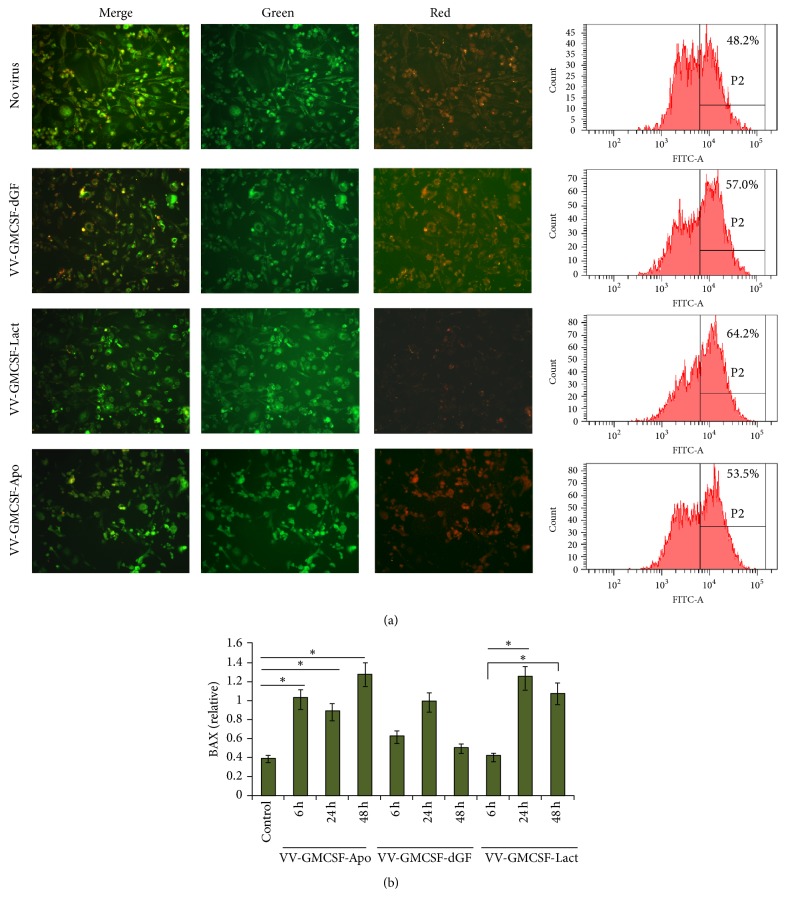
Figure 4.
Analysis of activation of mitochondrial apoptosis. MDA-MB-231 cells were treated with VVs (0.05 PFU/cell). (a) Fluorescence microscopy and flow cytometry of infected cells (36 h after infection) treated with JC-1 indicator. Representative data of two independent experiments. (b) BAX expression in VV-infected cells (0.05 PFU/cell). Cells were treated with VVs for the indicated time. The quantification of western blot data was performed using Gel-Pro Analyzer software. Data are presented as mean ± SD (n = 2); ∗p < 0.05 versus control (nontreated cells).

