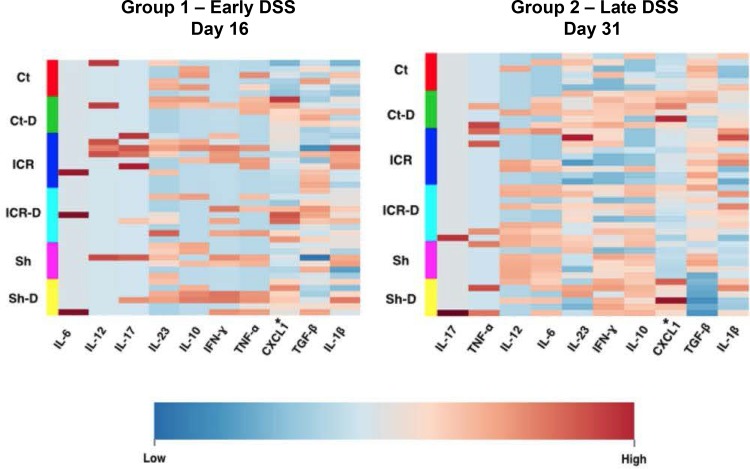
Fig 6. Terminal ileum cytokine profiles did not change after ICR with DSS treatment.
Tissue cytokine concentrations were determined using the pro-inflammatory multiplex array (Meso Scale Discovery). Heat Maps were constructed using MetaboAnalyst 3.0. *indicates significantly different across all groups P ≤ 0.005 determined by ANOVA with log transformation. Cytokines in plots are presented in order importance for separation of the groups.

