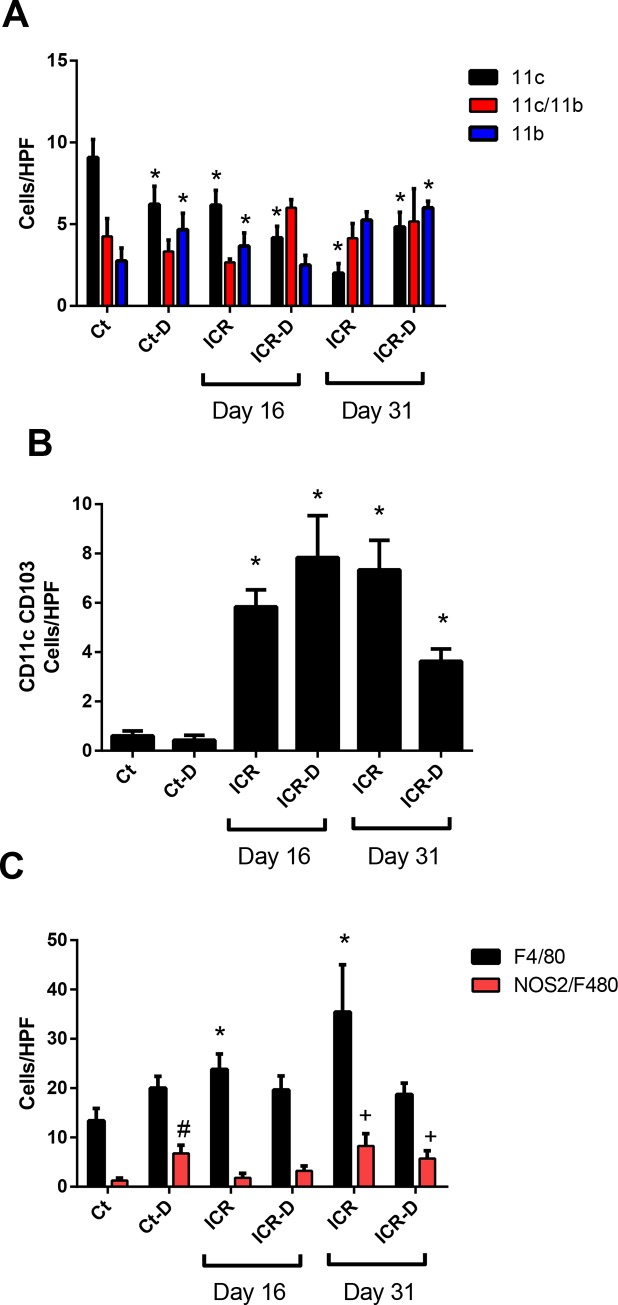
Fig 8. Cell counts from immunofluorescence stained colonic tissue sections.
(A) Cells labelled with CD11c and CD11b. In controls, DSS treatment decreased numbers of CD11c+ cells and increased numbers of CD11b+ cells. At day 16, ICR mice had decreased CD11c+ cells and increased CD11b+ cells. DSS treatment in ICR mice eliminated the rise in CD11b+ cells. At day 31, CD11c+ cells remained decreased in the ICR and ICR-D groups, but CD11b+ cells had increased in both groups. Data is shown as Mean ± SEM. Counts were performed on 6 representative photomicrographs from n = 3/group. * p ≤ 0.05 relative to Ct. (B) Cells labelled with CD11c and CD103. ICR and ICR-D mice had increased numbers of CD11c+CD103+ cells at day 16 and at day 31. Data is shown as Mean ± SEM. Counts were performed on 6 representative photomicrographs from n = 3/group. * p ≤ 0.05 relative to Ct and Ct-D. (C) Cells labelled with F4/80 and NOS2/F4/80. At day 16 and 31, ICR and ICR-D mice had increased levels of F4/80+ cells. Data is shown as Mean ± SEM. Counts were performed on 6 representative photomicrographs from n = 3/group. * p ≤ 0.05 relative to Ct and Ct-D; # p ≤ 0.05 with Ct; +p<0.05 compared with Day 16 ICR and ICR-D.

