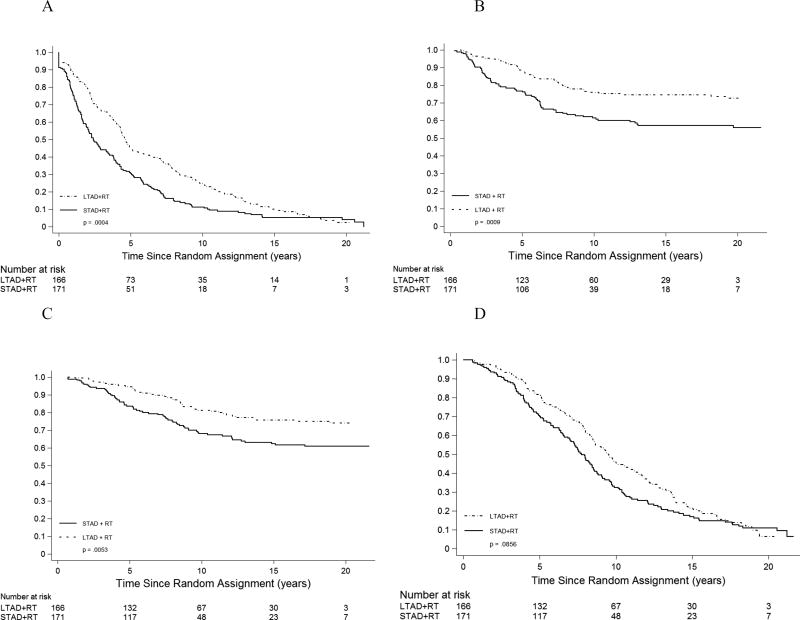
Figure 2.
Disease-free survival (A), distant metastasis (B), death from prostate cancer (C), and overall survival (death from any cause) (D) by treatment group for patients with Gleason score 8- 10 and N0/NX nodal status. Plots in panels A and D are Kaplan-Meier curves; plots in panels B and C are (1 – cumulative incidence estimator). P-values are from unadjusted logrank tests. See Table 3 for adjusted hazard ratios and p-values.

