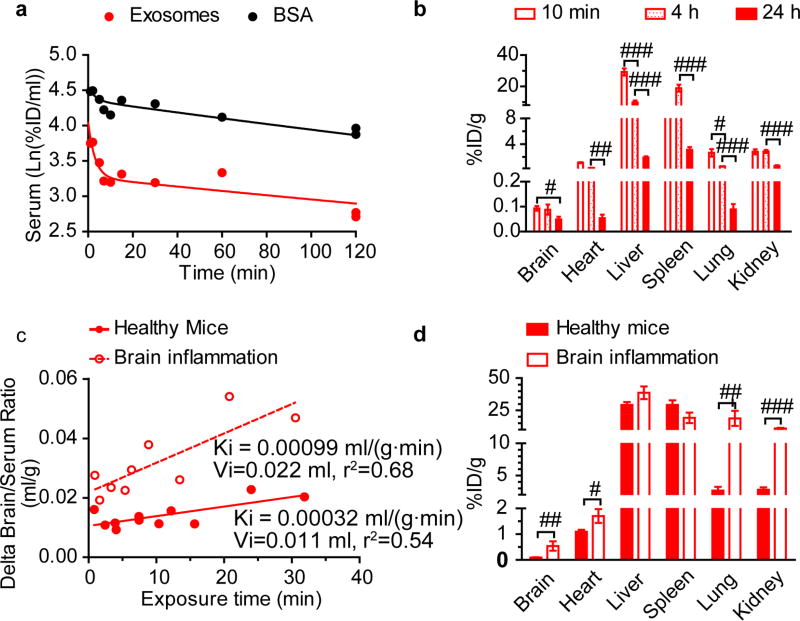
Figure 4. PK and distribution of Mϕ exosomes in healthy and brain-inflamed CD-1 mice.
The brain inflammation in CD-1 mice was induced by intracranial injection of 10 µg LPS 24 h before the exosome administration. The mice were co-injected with 125I-exosomes and 131I-BSA via jugular vein. (a) Clearance of exosomes and BSA in healthy mice. (b) Distribution of exosomes in healthy mice. (c) Multiple-time regression analysis of exosomes for brain influx rate in healthy and brain-inflamed mice. Delta brain/serum ratios were calculated by subtracting the brain/serum ratios of BSA from those of exosomes to correct for vascular space [28]. (d) Distribution of exosomes at 10 min. Tissue accumulation was corrected for vascular space using BSA data. Data are means ± SEM, n = 3-6. # p < 0.05, ## p < 0.01, and ### p < 0.001 vs. indicated group by unpaired two-tailed t-test.

