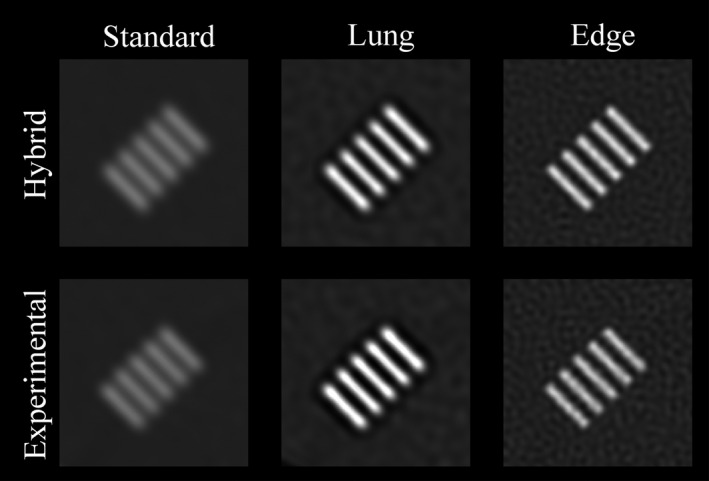
Figure 3.

Validation of the hybrid image generation method. The top row shows images of a bar pattern (6 lp/cm) generated by the hybrid method (simulated signal + experimental noise background). The bottom row shows experimental images of the bar pattern. The image display window and level are 2000 and 300 HU, respectively.
