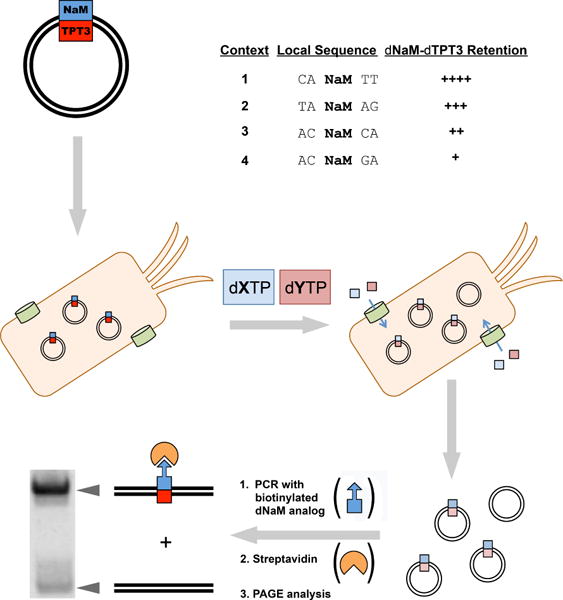
Figure 2.

Graphical representation of screen workflow. For sequence contexts 1 – 4, X denotes NaM or a NaM analog and Y denotes TPT3 or a TPT3 analog. Retention levels of dNaM-dTPT3 are indicated with “+” symbols. See Ref 14 for original report of dNaM-dTPT3 retention data.
