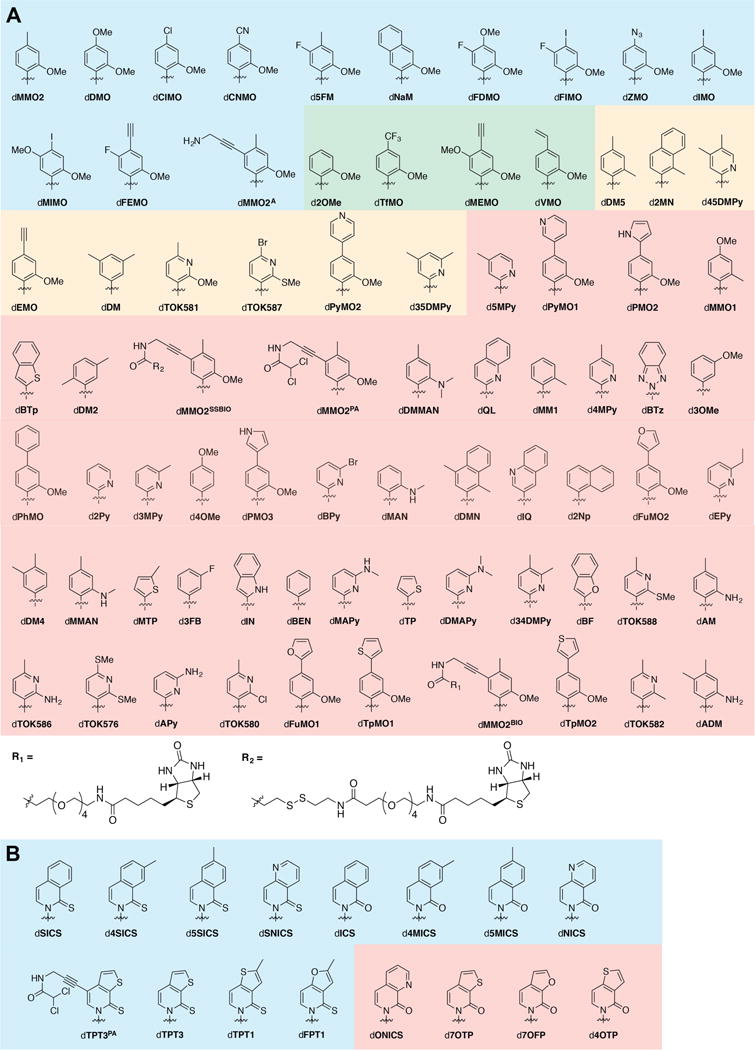
Figure 3.

Structure of analogs used in current study. (A) dNaMTP analogs. Blue shading corresponds to analogs that at 125 μM showed greater than 90% retention in phase 1 of the screen. Green shading corresponds to those that at 125 μM showed retentions between 50% and 90% in phase 1. Orange shading corresponds to those that at 125 μM showed between 20% and 50% retention. Red shading corresponds to those that at 125 μM showed less than 20% retention. (B) dTPT3 analogs. Blue shading corresponds to those that at 10 μM showed greater than 90% retention in phase 1 of the screen and red shading corresponds to those that showed less than 10% retention at the same concentration. Ribose and phosphates omitted for clarity. For original references see Supporting Information.
