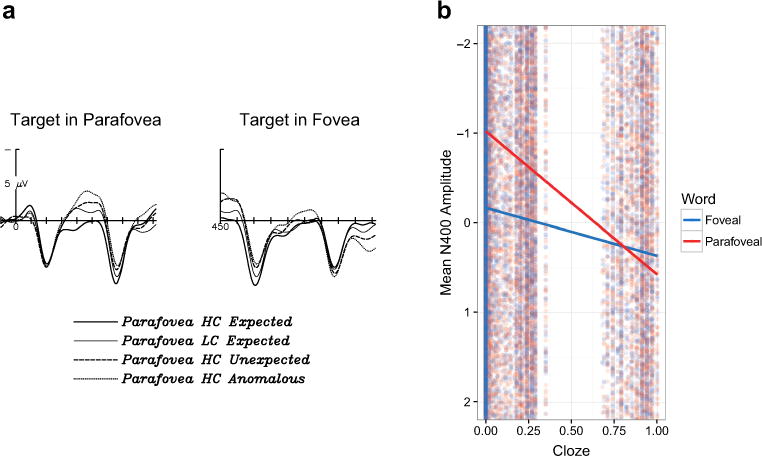
Fig. 4.

a) Grand-average ERPs at the middle central electrode comparing the parafoveal N400 congruency effect (left panel) and foveal N400 congruency effect (right panel). Note that negative is plotted up. The same baseline period was used for both measurements: 100 ms prestimulus onset of the target-in-parafovea. As such, the foveal effect is simply plotted starting from the onset of the target word in the fovea, which occurred at 450 ms after the time-locking point (i.e., 450 ms after the target appeared in the parafovea, in the middle of the N400 to the parafoveal word). b) Plot of individual item-level N400 amplitude by cloze probability, overlaid with the slope of the cloze effect for the parafoveal N400 (red) and foveal N400 effect (blue). Note that negative is plotted up, for ease of comparison with the ERP plot in a. The steeper slope for the parafoveal effect indicates that parafoveal N400 amplitudes were graded with respect to cloze probability, whereas the flatter slope of the foveal N400 effect shows that this effect was largely eliminated in foveal processing
