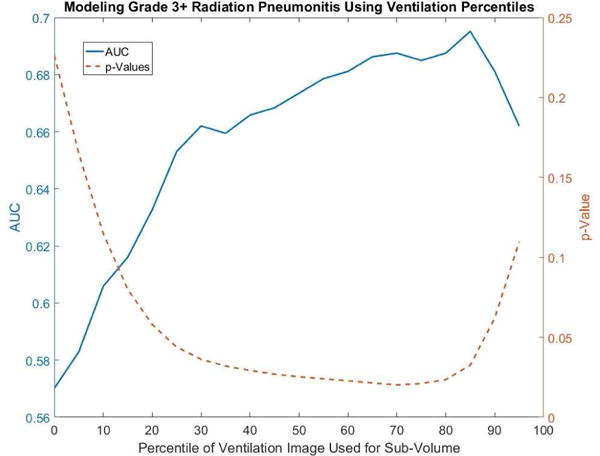
Figure 3.

A plot of the area under the curve (solid blue) and the p-Value (dashed orange) as a function of the cutoff in determining functional lung sub-volumes demonstrates the trend toward higher predictive power in modeling grade 3+ pneumonitis when evaluating areas of higher functioning lung. The metric of evaluation is the percent of functional lung receiving ≥20Gy.
