Figure 1.

Cumulative Risk Score by SES Group
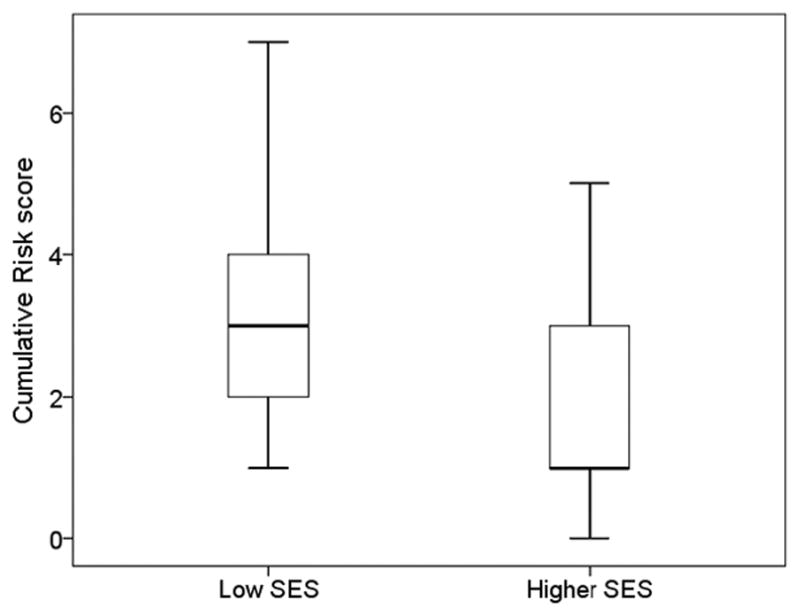
Legend: Boxplots show 25th, 50th and 75th percentiles for Cumulative Risk by SES group. The Cumulative Risk score is higher in Low SES compared to Higher SES infants (p<0.001).

Cumulative Risk Score by SES Group
Legend: Boxplots show 25th, 50th and 75th percentiles for Cumulative Risk by SES group. The Cumulative Risk score is higher in Low SES compared to Higher SES infants (p<0.001).