
Figure 1. Generation of a mouse model with cell-type-specific inducible expression of APOL1 variants.
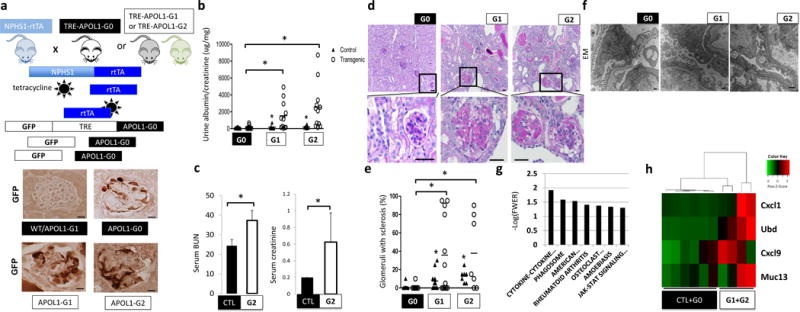
(a) Upper: schematic representation of mouse model generation. Lower: representative images of GFP immunostaining. (n = 15 per line) Scale bars, 10μm. (b) Urine albumin/creatinine ratio (ACR) of NPHS1-rtTA/TRE-APOL1-G0 (n = 11), NPHS1-rtTA/TRE-APOL1-G1 (n = 11), NPHS1-rtTA/TRE-APOL1-G2 (n = 12) mice. Single transgenic littermates served as controls (ctl) (n = 8, 6, 6 for G0, G1 and G2, respectively). Statistics was calculated by Student’s t-test, P = 0.0154 (G0 vs. G1), P=0.0077 (G0 vs. G2). (c) Serum blood urea nitrogen (BUN) and creatinine levels of control (CTL) (n = 6) and NPHS1-rtTA/TRE-APOL1-G2 (n = 4) mice on doxycycline diet for 12–19 days. Student’s t-test, P = 0.0042 (BUN), P = 0.0279 (creatinine). The data are presented as means ± s.d. (d) Representative PAS-stained kidney images of NPHS1-rtTA/TRE-APOL1-G0, NPHS1-rtTA/TRE-APOL1-G1 and NPHS1-rtTA/TRE-APOL1-G2 mice. The bottom images are higher magnifications of the boxed regions in the top images. (n > 5 per line) Scale bars: upper panels: 20μm; lower panels: 10μm. (e) Quantification of the histological findings of NPHS1-rtTA/TRE-APOL1-G0 (n = 12), NPHS1-rtTA/TRE-APOL1-G1 (n = 12), NPHS1-rtTA/TRE-APOL1-G2 (n = 7) mice. Student’s t-test, P = 0.0087 (G0 vs. G1), P = 0.0048 (G0 vs. G2). (f) Representative transmission electron micrographs (TEM) of NPHS1-rtTA/TRE-APOL1-G0/G1/G2 mice. (n = 26, 74, 54 for G0, G1, G2 mice, respectively) Scale bar: 500nm. (g) Differentially expressed pathways by RNAsequencing identified using gene set enrichment analysis. Y-axis log (p) of the false discovery rate (FWER: family-wise error rate). (h) Heatmap analysis of mouse orthologs of Ubd, Cxcl9, Cxcl1 and Muc13, previously reported to be differentially expressed in APOL1 high vs. low risk allele nephrotic syndrome subjects. Higher transcript levels are shown in red, while lower in green.