
Figure 6. Mice with podocyte specific APOL1 risk allele expression show increased podocyte loss, autophagy block and increased inflammatory cell death.
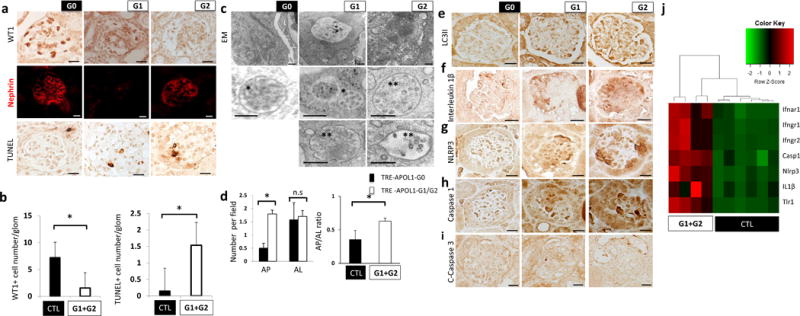
(a) Representative immunohistochemistry images of WT1 (upper), nephrin (middle) and TUNEL staining (lower) in NPHS1-rtTA/TRE-APOL1-G0/G1/G2 mouse kidney sections. (n > 5 per line) Scale bars, 10μm. (b) Left panel: Quantification of stained cells per glomerulus of WT1 (a podocyte marker), in transgenic mice. n = 11 analyzed images per condition. Student’s t-test, P =0.0036 compared to NPHS1-rtTA/TRE-APOL1-G0 mice and single transgenic control mice. Right panel: Quantification of stained cells per glomerulus of TUNEL stain from transgenic mice. n = 12 analyzed images per condition. Student’s t-test, P = 0.0011 compared to NPHS1-rtTA/TRE-APOL1-G0 mice and single transgenic control. (c) Representative transmission EM images of podocytes from transgenic mice showing increased numbers of MVB and autophagosomes. Inserts show multivesicular bodies (*) and amphisome-like structures (**). Scale bars, 500nm. (d) Quantification of autophagosomes (AP) and autolysosomes (AL) in transgenic mice. Note increased ratio of AP to AL in G1 and G2 mice compared to G0 mice. n > 50 analyzed organelles per each condition. Data are presented as means ± s.e.m. and Student’s t-test, P = 8.1816e-07 (left panel), 0.037 (right panel) compared to NPHS1-rtTA/TRE-APOL1-G0 mice. (e) Representative immunohistochemistry images of LC3II from transgenic mice. Note the increased podocyte stain in G1 and G2 mice compared to G0 mice, suggesting increase in autophagic vacuole content. (n > 5 per line) Scale bars, 10μm. (f–h) Representative immunohistochemistry images of IL1β, NLRP3 and caspase1, showing increased stain of pyroptosis proteins in podocytes of G1 and G2 mice, compared to G0 mice. (n > 5 per line) Scale bars, 10 μm. (j) Representative immunohistochemistry images of cleaved caspase3 from transgenic mice. Note lack of detectable stain, indicating apoptosis is not significantly induced in transgenic mice. (n > 5 per line) Scale bars, 10 μm. (i) Differential expression of a set of genes by RNA-seq analysis in kidneys of NPHS1-rtTA/TRE-APOL1-G0/G1/G2 mice. Single transgenic littermates and NPHS1-rtTA/TRE-APOL1-G0 are controls.