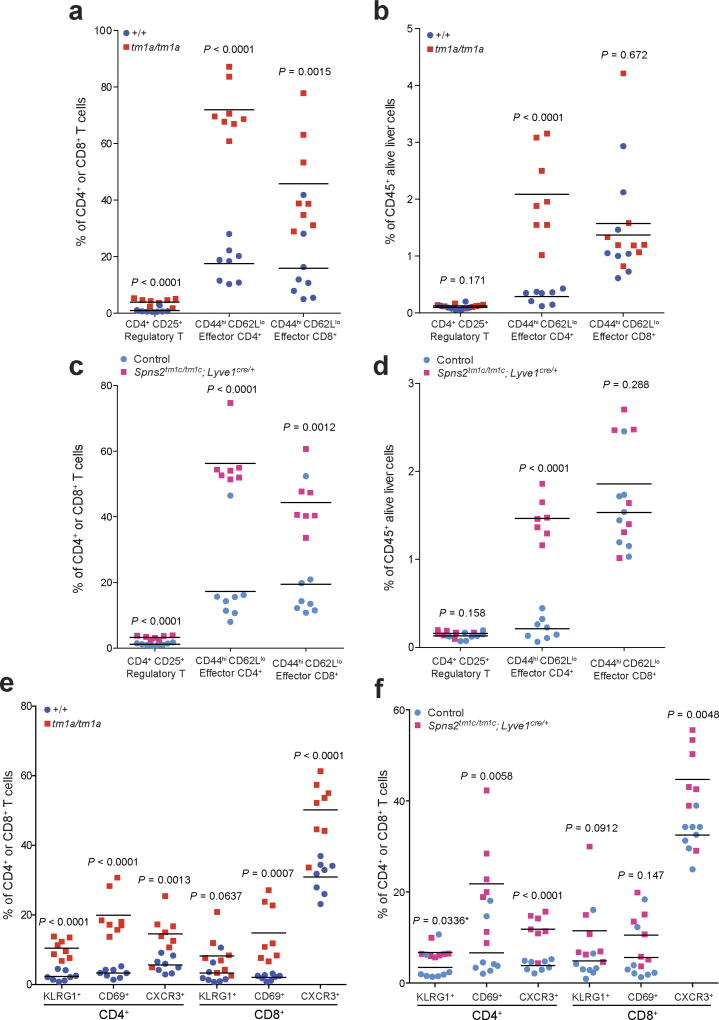
Extended Data Figure 7. T cell subsets in the liver of Spns2 mice.
The proportion of T cell subsets present in the liver of naive +/+ versus tm1a/tm1a female mice and control versus Spns2tm1c/tm1c; Lyve1cre/+ male mice. Data are shown as percentage of parent CD4+ and CD8+ T cells (a, c, e, f) or percentage of CD45+ alive liver cells present (b, d). Symbols represent individual mice; statistical analysis used multiple two-tailed unpaired t-tests with P value adjusted by the Holm–Šídák method with α set to 5%, with * indicating a P value not considered significant after correcting for multiple testing. Data shown are representative of three independent experiments.

