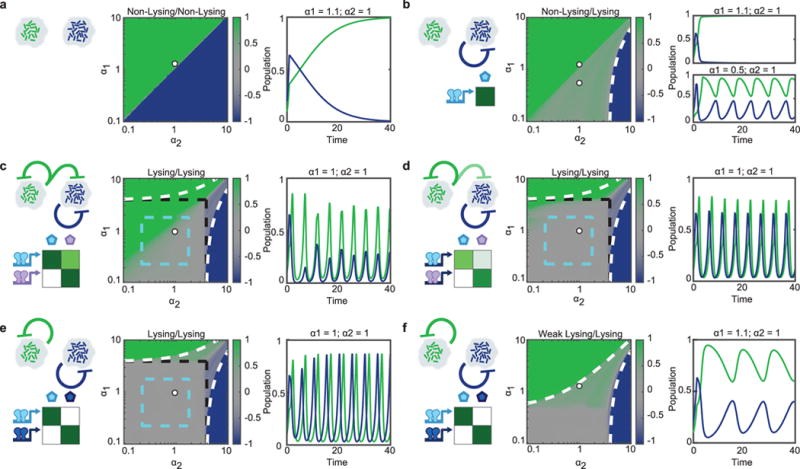
Fig. 4.

Prediction of synchronized lysis circuit dynamics in a dual strain population using various communication motifs. Model-generated heat maps depicting time-averaged population ratio of green and blue strains in a well-mixed, constant flow co-culture, as function of green’s growth rate α1 against blue’s growth rate α2. Each panel has a particular combination of lysis regimes for each of the strains, either Non-Lysing, Lysing, or Weak Lysing (see Methods Summary for details). On the left of each heat-map is the communication motif it exhibits and experimental candidate QS systems to achieve the desired signaling characteristic. These traits determine the behavior and composition of the co-culture. The white dot on the heat map indicates the growth rate parameters selected for the time-series plots. Time series plots show population of the green and blue strains as a function of time. a, Two non-lysing strains. b, One non-lysing strain and one lysing strain. White, dashed lines indicate the growth rate at which one strain’s growth rate exceeds that of the other one even for maximum lysis activation. c, Two lysing strains with one strain having a strong response to the other’s QS signal. Cyan dashed lines indicate the region where both strains are in the oscillatory regime, black dashed lines mark the area in which strains are self-limiting. d, Two lysing strains with one strain having a weak response to the other’s QS signal. e, Two completely orthogonal lysing strains. The rpa and lux systems could be used for this dynamic as they are signal orthogonal. f, Two completely orthogonal strains with the green strain in the weak lysis regime (leading to constant lysis), and the blue strain in the lysis regime. This is the regime corresponding to our experimental system. Oscillations in the green strain’s population are imposed by the oscillatory blue strain through volume exclusion.
