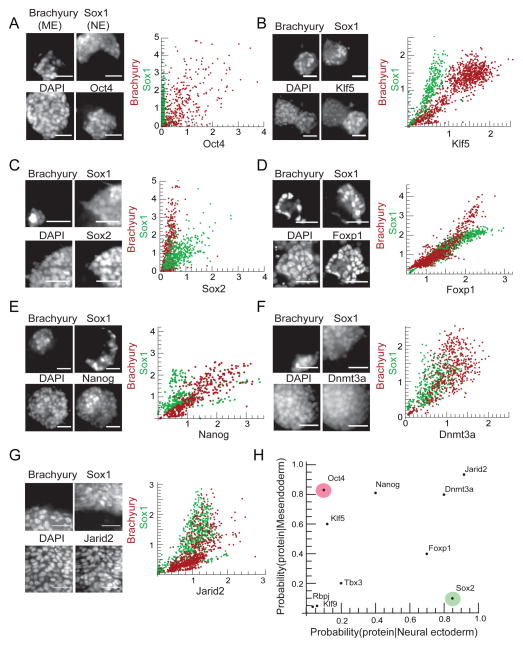
Figure 3. Key ES cell transcription factors are differentially expressed in ME and NE cells.
Cells were differentiated in conditions (see Experimental Procedures) where some cells adopted the ME fate (Brachyury positive) and others adopted the NE fate (Sox1-GFP positive). Images of a field of cells immunostained 36 hours after signal addition for ME marker Brachyury, NE marker Sox1, DAPI, and a specific factor (left panel); scatter plots (right panel) of the expression level of that factor against Brachyury in n > 300 Brachyury positive cells (red points) and against Sox1, n > 300 Sox1 positive cells (green points) for (A) Oct4, (B) Klf5, (C) Sox2, (D) Foxp1, (E) Nanog, (F) Dnmt3a and (G) Jarid2. All scale bars 32μm. (H) The data from A–G are summarized in a conditional probability plot. Each point in the plot represents the probability of finding the expression of the specific protein in ME progenitors (y-axis) versus NE progenitors (x-axis). See also Figure S3.

