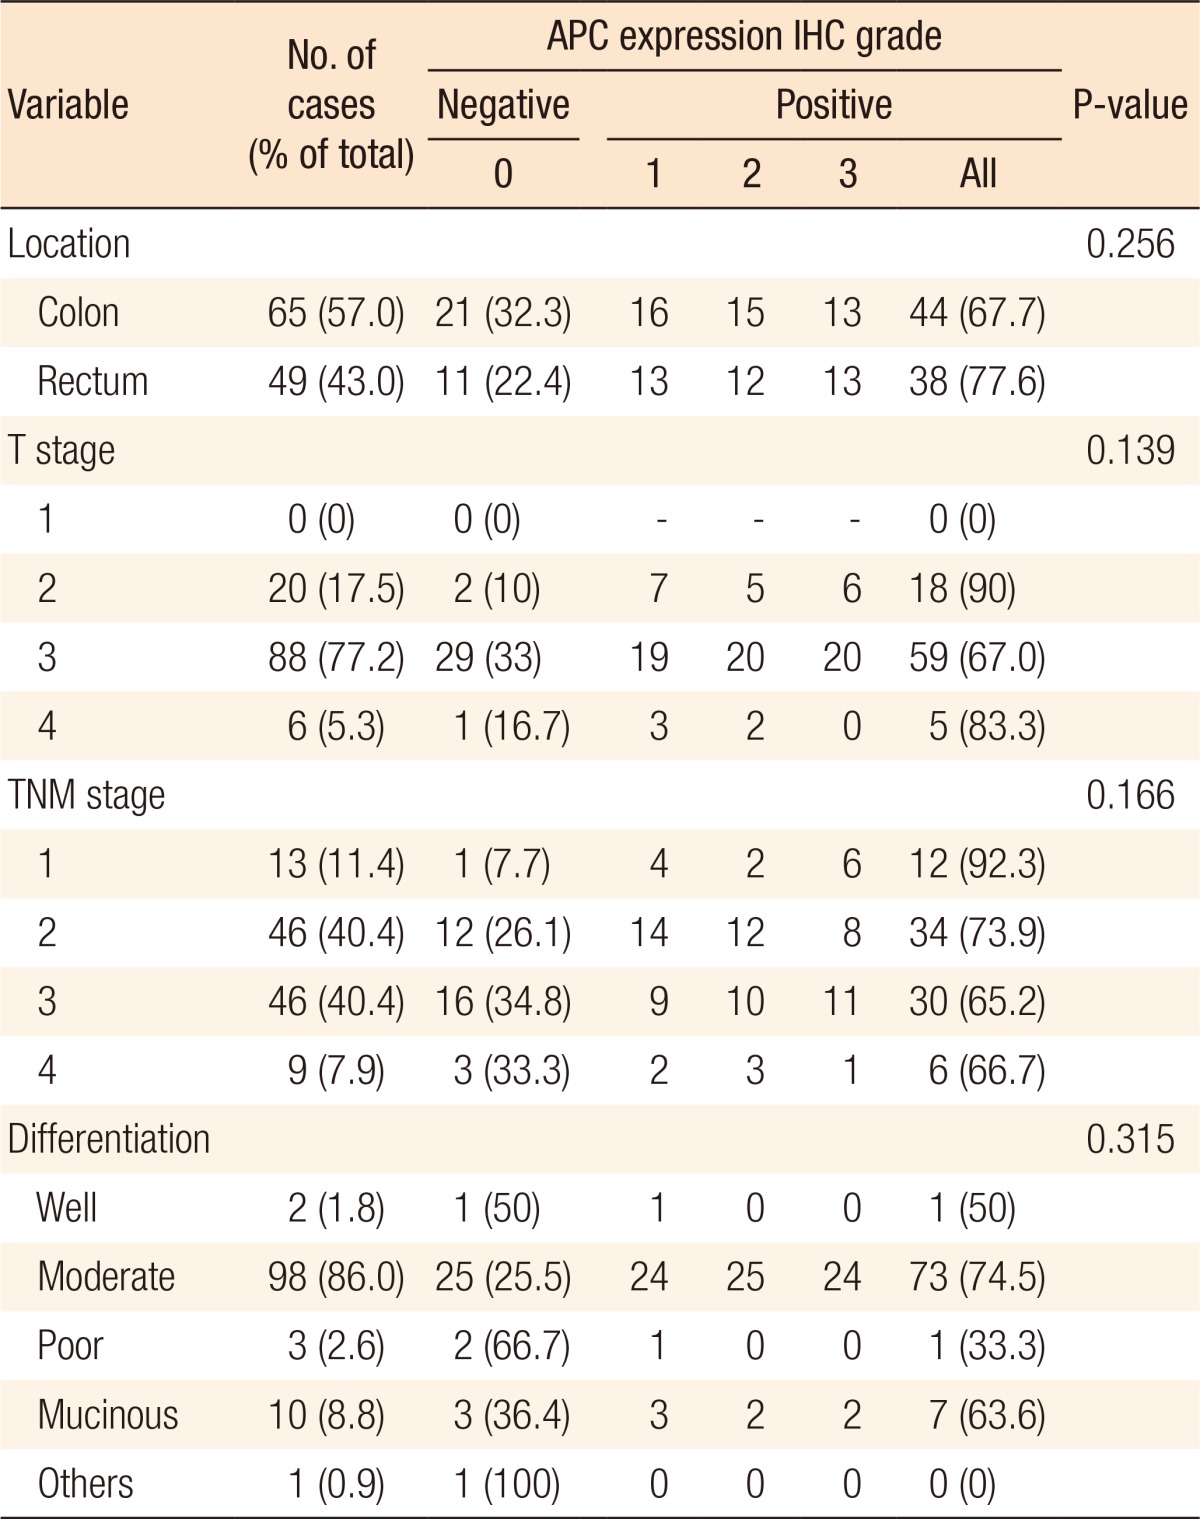
Table 2. Patients' clinical and pathological characteristics of the whole sample and their associations between the 2 treatment subgroups.

Values are presented as number of cases (%).
APC, anaphase-promoting complex; IHC, immunohistochemistry.

Values are presented as number of cases (%).
APC, anaphase-promoting complex; IHC, immunohistochemistry.