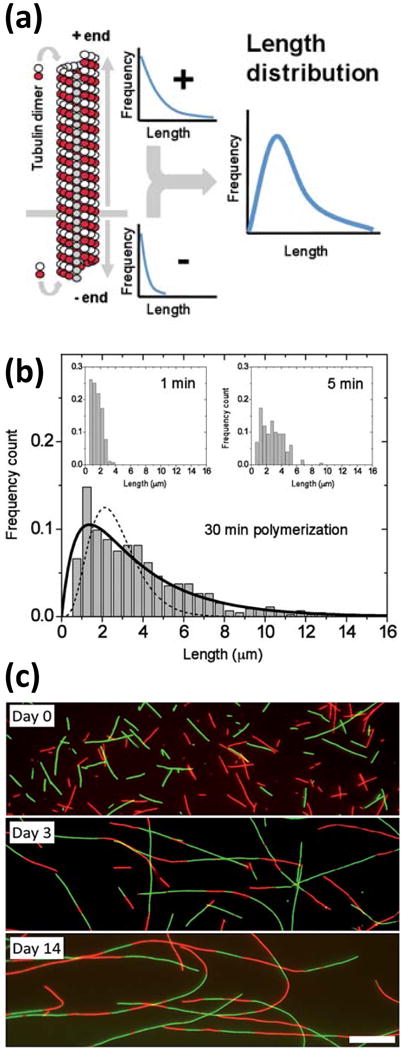
Figure 2.

(a) Microtubule assembly proceeds at both ends with unequal rates, giving rise to a length distribution with a peak at intermediate lengths. (b) An equilibrium between tubulin addition and removal is established within minutes. (c) Mixing two microtubule populations of different fluorescent labels (red and green) reveals end-to-end joining of microtubules observed on a timescale of days. Scale bar: 10 μm. (a) & (b) reproduced from10 and (c) reproduced from9 with permission from the Royal Society of Chemistry.
