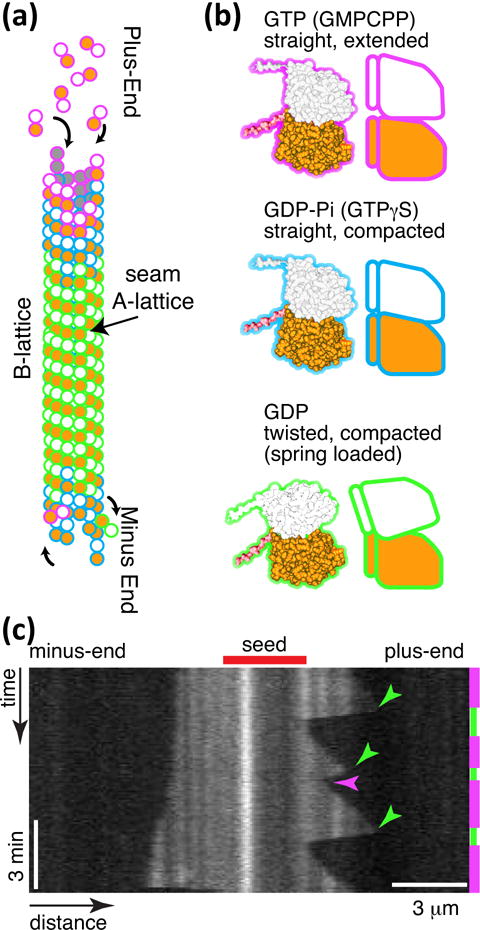
Figure 3.

Microtubule dynamics. (a) Microtubule lattice with GTP cap at plus and minus ends, and GDP tubulin in the body. The lattice is a B-lattice, with alpha-alpha lateral interactions. (b) Tubulin conformations GTP, straight and extended conformation, GDP-Pi straight and compacted conformation, and GDP in the compacted and twisted conformation. (c) Space-time plot (kymograph) of microtubule length dynamics over time. Images of microtubules are laid adjacent to show the length changes over time. Magenta time segments on the right denote growth, and green segments denote depolymerisation. Catastrophes are denoted with green arrow heads, and one rescue is denoted with a magenta arrowhead. This experiment was performed at 20 μM free tubulin. The plus-end is on the right, and the minus-end is on the left. Vertical scale bar: 3 min. Horizontal scale bar: 3 μm.
