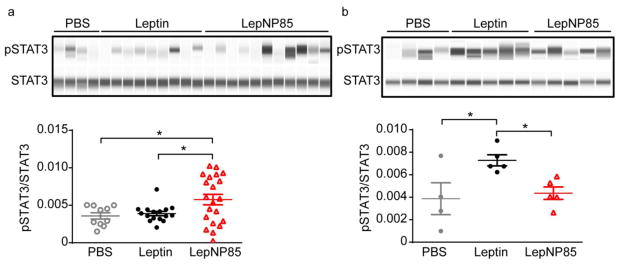
Figure 13. Phosphorylation of STAT3 in hypothalamus 1 h after intranasal injection of leptin and LepNP85.
(a) At dose of 5 μg/mouse. n=4–11. The western blotting was repeated twice. (b) At dose of 12 μg/mouse. n= 4~5. Data are mean ± SEM, * p < 0.05 by One-way ANOVA and post Newman-Keuls Multiple Comparison Test.

