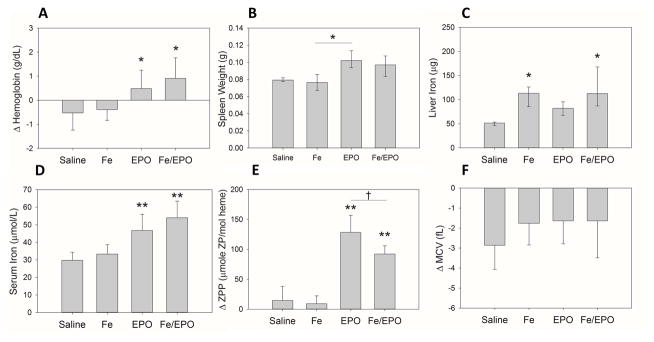
Figure 1. The hematologic and iron parameters of uninflamed control WT mice after treatment with exogenous Fe Dextran and/or EPO.
(A) Δ Hemoglobin. (B) Spleen weights. (C) Liver iron. (D) Serum iron. (E) Δ Serum ZPP. (F) Δ MCV. Panel A: Treatment groups each included 8 evaluable male mice; means ± SD are shown; *p<0.05 compared to saline group, by Holm-Sidak method. Panel B: Treatment groups each included 4 male mice; medians ± 75th/25th percentile are shown; *p<0.05 by Tukey test. Panel C: Treatment groups each included 8 male mice; medians ± 75th/25th percentile are shown; *p<0.05 compared to saline group, by Dunn’s method. Panels D–F: Treatment groups each included 7–8 male mice; means ± SD are shown; **p<0.001 compared to saline group, †p<0.05, by Holm-Sidak method.

