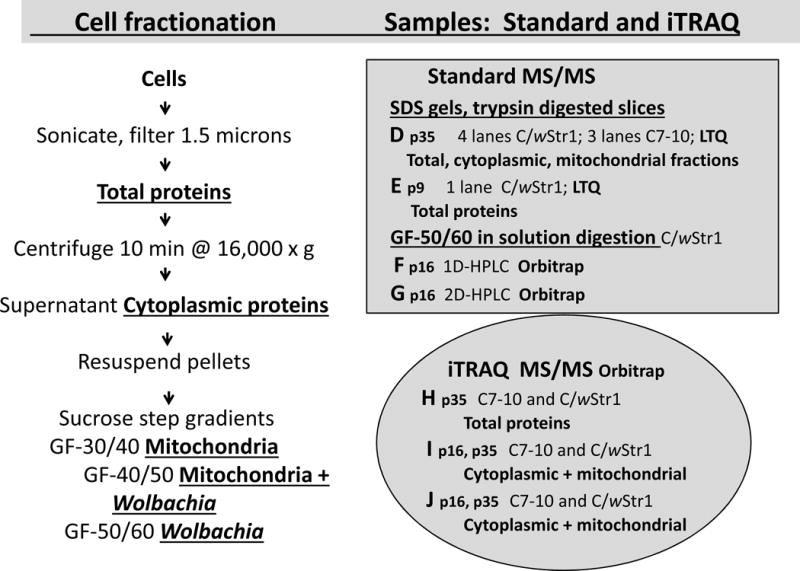
Fig. 1.

Sample preparation for MS/MS analysis. Samples were prepared according to the flow chart at left as detailed earlier by Baldridge et al. [27]. Underlined, bold text designates fractions used in the analyses at right. The shaded rectangle shows samples D (p16), E (p9), F (p16) and G (p16), from which host proteins were identified in a standard analysis, and the shaded oval represents samples H (p35), I, (p16 and p35) and J (p16 and p35) used for iTRAQ analysis; note that “p” designates passage number. Samples for MS data sets D and E were separated by SDS-PAGE and recovered from gel slices that were trypsin-digested in situ for protein identification by LTQ MS/MS. Data sets F and G were derived from the Wolbachia-enriched gradient fraction GF-50/60 digested in-solution with trypsin for HPLC separation of peptides and protein identification by Orbitrap MS/MS [27]. For the iTRAQ analysis, aliquots of total, cytoplasmic or mitochondrial fractions (pooled GF-30/40 and GF-40/50) from C7–10 and C/wStr1 cells were labeled with isobaric tags in three 4-plex reactions for protein identification by Orbitrap MS/MS.
