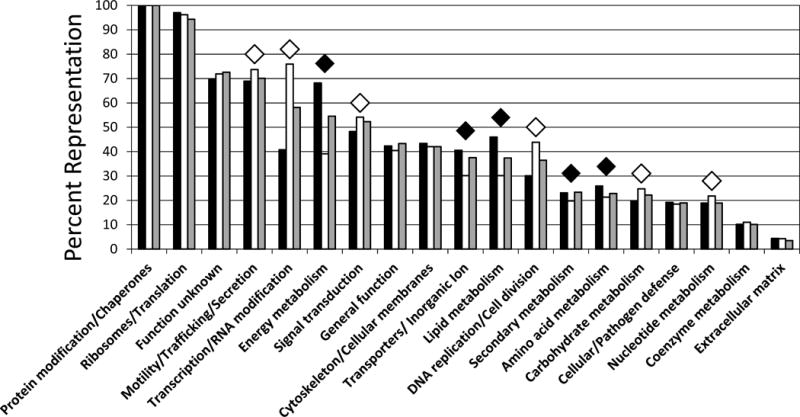
Fig. 3.

Distribution of identified Aedes host proteins by functional class. Individual protein identifications (8,313) in standard data sets D and E (see Table 1 and Fig. 1) and iTRAQ data sets H, I and J (3,177 identifications) were grouped into functional classes and normalized to numbers in the largest class, Protein modification/chaperones, defined as 100%. Functional classes were sorted left to right based on decreasing percentages in iTRAQ (gray bars). Diamond symbols indicate functional classes in which the ratio of C/wStr1 (black bars) relative to C7–10 (white bars) ranged from 0.5–0.9 (white diamonds) or 1.2–1.7 (black diamonds). Note that over 30% of proteins in the small Inorganic ion metabolism class (Table S1, sheet 1) have roles in ion transport and have been merged with the larger transporters class.
