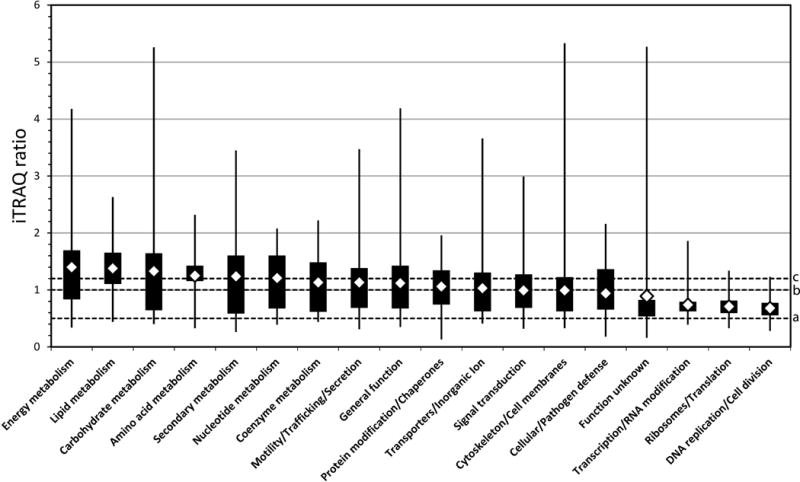
Fig. 4.

Distribution of Aedes host proteins with differential iTRAQ ratios by functional class. Average ratios by functional class were calculated from 1,307 observations (representing 815 consensus proteins listed in Table S4). Ratios are depicted in decreasing order on a linear scale, which was converted to log scale for statistical analyses described in the text. Diamonds indicate mean ratios (listed in Table 4), filled boxes represent first through third quartiles, and bars indicate minimum and maximum values. A small number of proteins with differential ratios in the inorganic ion and extracellular matrix class were included in the transporter and cytoskeleton/cell membrane classes, respectively.
