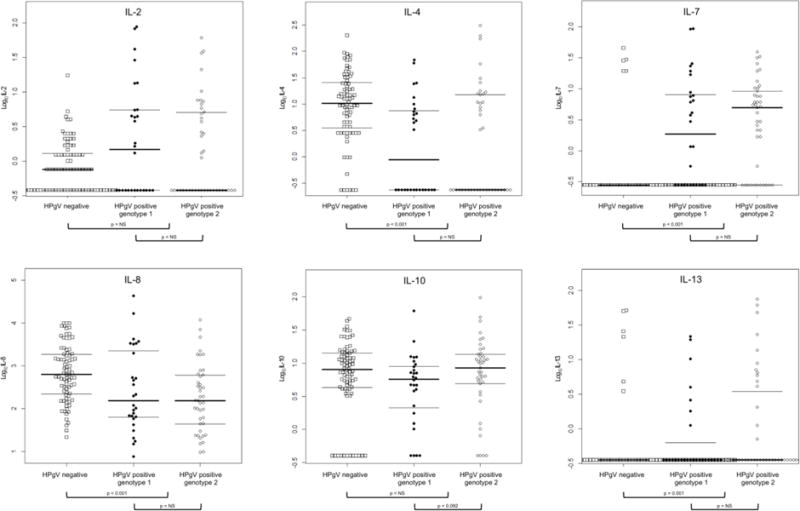
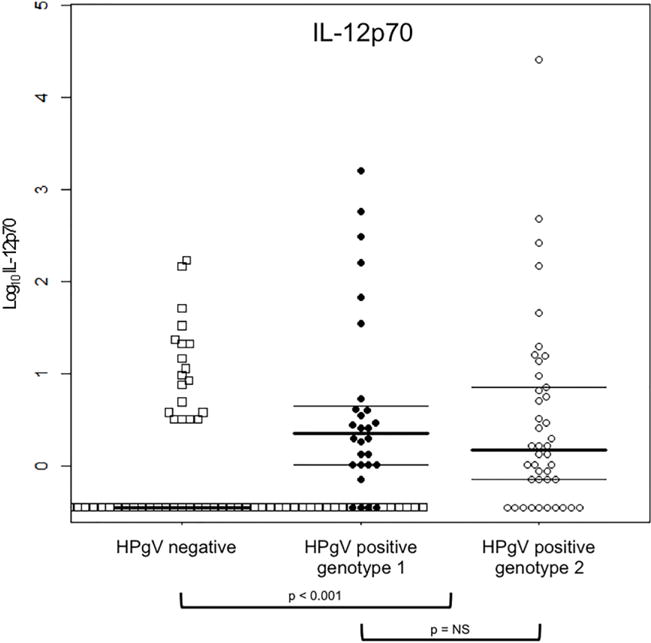
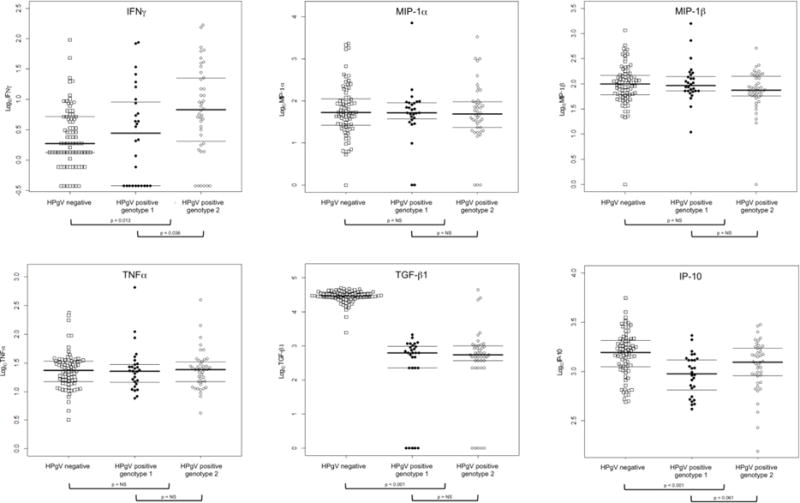
Figure 1.


Log-transformed cytokine/chemokine levels (in pg/mL) in serum are shown based on HPgV status (squares for HPgV negative or circles for HPgV positive) and genotype (closed circles for genotype 1 or open circles for genotype 2). Thick horizontal bars denote the median value for each group, while thin horizontal bars denote the 25th and 75 percentile. The values at the bottom of each cytokine/chemokine denote the relative proportion of undetectable data. Only p values < 0.10 are shown; all others are labeled ‘NS’ (not shown)
