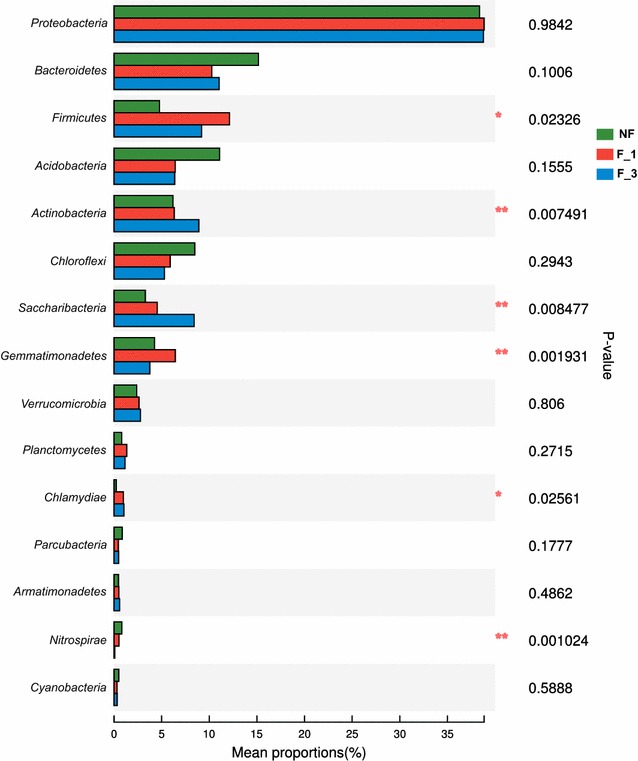
Fig. 2.

Average relative abundance of the mainly abundant phyla within the different fumigation years (n = 3). Stars indicate significant enrichment (One-way ANOVA, P < 0.05; Multiple testing adjustment, FDR) in the different fumigation years. 0.01 < P ≤ 0.05, one star; 0.001 < P ≤ 0.01, two stars; P ≤ 0.001, three stars. NF non-fumigation, F_1 chloropicrin-fumigation for 1 year, F_3 continuous chloropicrin-fumigation for 3 years
