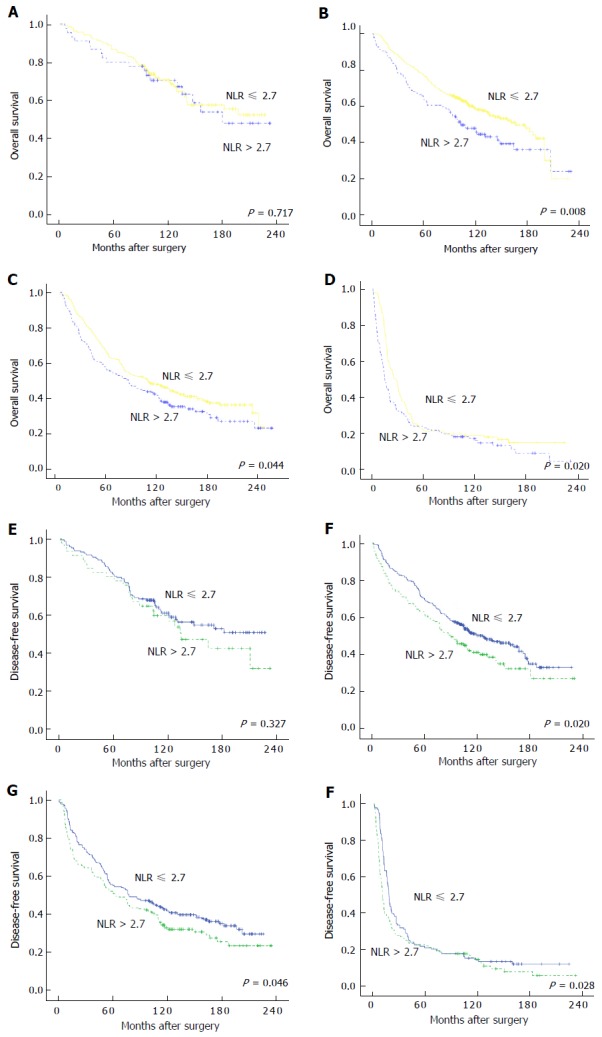
Figure 4.

Kaplan-Meier curves of overall survival and disease-free survival of colorectal cancer patients based on different levels of neutrophil-lymphocyte ratio. A-D: OS for cases with stages I, II, III, and IV CRC, respectively; E and F: DFS for cases with stages I, II, III, and IV CRC, respectively. OS: Overall survival; DFS: Disease-free survival; CRC: Colorectal cancer; NLR: Neutrophil-lymphocyte ratio.
