
Figure 4.
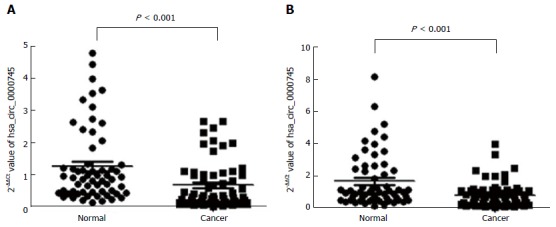
Hsa_circ_0000745 expression levels. A: Hsa_circ_0000745 expression levels in gastric cancer tissues and paired adjacent non-tumor tissues; B: Hsa_circ_0000745 expression levels in plasma samples from patients with gastric cancer and healthy volunteers. P < 0.001, n = 60. The expression is shown as the 2- ΔΔCt value.