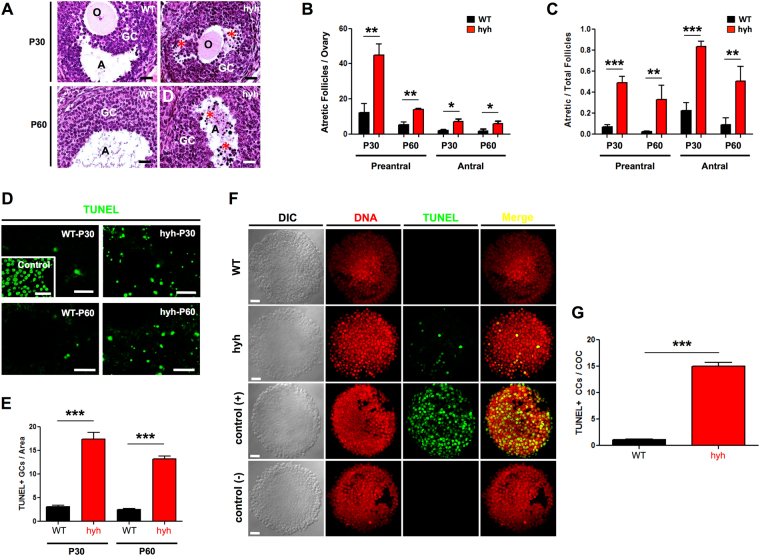
Figure 4.
Follicular atresia and apoptosis of granulosa cells (GCs) in α-SNAP mutant (hyh) ovaries. (A) Sections of ovaries obtained from P30 and P60 WT and hyh mutant mice stained with hematoxylin-eosin. Magnifications of parts of the ovaries showing representative follicles. Atretic follicles characterized by the presence of condensed (pyknotic) nuclei (red asterisks) at the mural GC layers and in the follicular antrum (A) were abundant in hyh mutant ovaries. O, oocyte. Scale bars, 50 μm. (B) Number of preantral and antral atretic follicles per ovary in P30 and P60 WT and hyh females. Bars represent mean ± SEM of 4 independent experiments. (C) Quantification of the relative number of atretic follicles among preantral and antral follicles in WT and hyh mutant mice at P30 and P60. Follicles were scored as atretic if they demonstrate at least 5% pyknotic nuclei. Bars represent mean ± SEM of 4 independent experiments. (D) Representative images of TUNEL assays in histological sections of WT and hyh mutant ovaries at P30 and P60. For positive controls (control), histological sections were incubated with recombinant DNase I prior to labeling procedures. Scale bars, 50 μm. (E) Quantification of TUNEL + granulosa cells and bodies per area. Bars represent mean ± SEM of 3 independent experiments. (F) Representative images of TUNEL assays in COCs isolated from P60 WT and hyh ovaries 48 h after PMSG (10 IU) treatment. Propidium iodide was used for DNA detection (DNA). DIC, differential interference contrast microscopy. Scale bars, 20 μm. (G) Quantification of TUNEL + cumulus cells (CCs) per cumulus-oocyte-complex (COC). Twenty-nine WT and 33 hyh COCs obtained from 3 WT and 3 hyh females were analyzed. Bars represent mean ± SEM. ***p < 0.001 (Student’s t-test).

