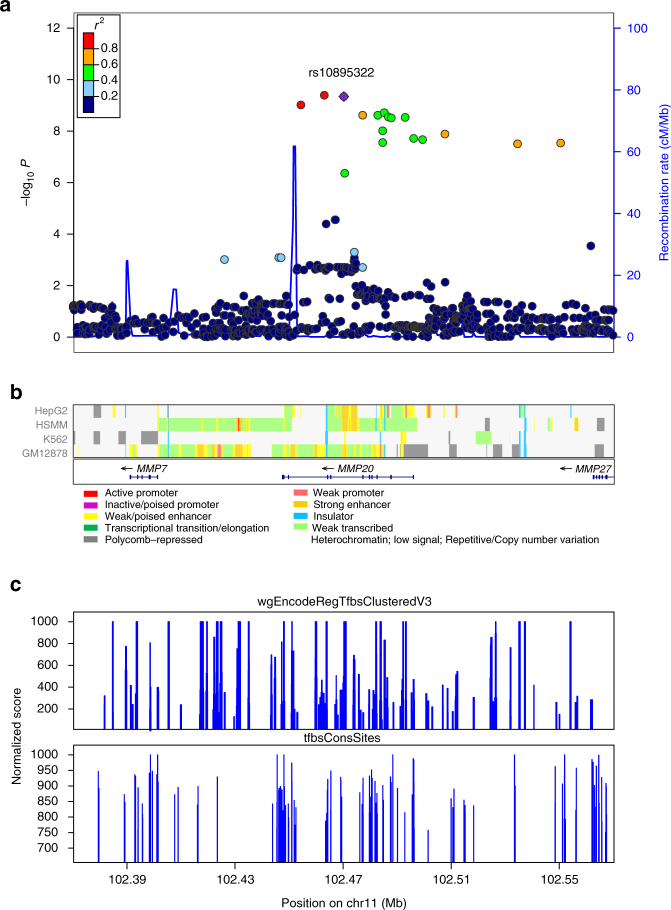
Fig. 1.
Regional association plot including both genotyped and imputed SNPs at 11q22.2. a Plotted are the regional association results from the meta-analysis of discovery and replication cohorts (−log10 transformed P values) and the recombination rate. SNPs are colored to reflect pairwise LD (r 2) with the most significantly associated SNP. The most significant SNP is shown in purple. The tracks of b CHROMHMM (Celline: HepG2, HSMM, K562, GM12878), c wgEncodeRegTfbsClusteredV3 and tfbsConsSites annotation are plotted on the bottom

