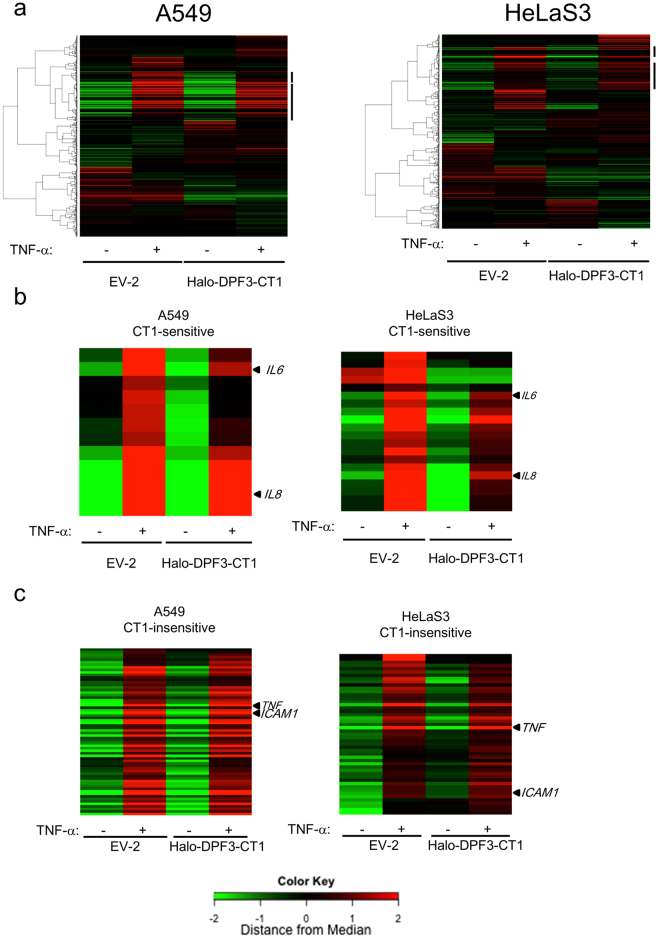
Figure 2.
Microarray analysis of NF-κB target genes induced by TNF-α in A549 and HeLaS3 cells. (a) Heat map generated by microarray analysis of reported NF-κB target genes. Cells transduced with Halo-DPF3-CT1–expressing retrovirus vector or empty vector (EV-2) were grown in the absence (TNF-α: −) or presence (TNF-α: +) of TNF-α (10 µg/ml) for 1 h. Total RNA was isolated and analyzed by microarray as described in the Materials and Methods. Quantile normalized expression data were calculated using R package. All reported NF-κB target genes (Boston University; http://www.bu.edu/nf-kb/) were clustered using four RNA samples (EV-1 ± TNF-α and Halo-DPF3-CT1 ± TNF-α). Bars on the right indicate the gene cluster regions including TNF-α inducible genes in these cells. (b,c) Heat map of TNF-α–induced NF-κB target genes that were either CT1-sensitive or CT1-insensitive. From the list of NF-κB target genes, we selected TNF-α inducible genes in A549 or HeLaS3 cells using the following criteria: expression ratio of TNF-α–treated EV-1 transduced cells to untreated EV-1 transduced cells >1.5 and a Z-score > 2. From these TNF-α inducible genes in either A549 or HeLaS3 cells (a total of 71 genes), CT1-sensitive genes (b) were further selected by the following criteria: ratio of CT1-expressing cells to EV-2 transduced cells <0.66 and a Z-score < −2. The other genes were classified as CT1-insensitive (c).

