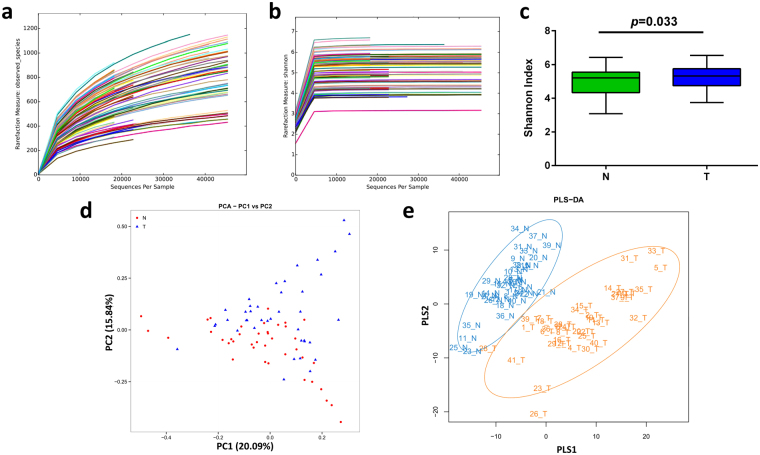
Figure 1.
Comparison of oral microbiota structures in the N and T groups. (a) Rarefaction analysis of bacterial 16 S rRNA gene sequences was performed to evaluate whether further sequencing would likely detect additional taxa, indicated by a plateau. Different colors represent different samples. (b) Shannon index curves were constructed to evaluate the numbers of samples likely required to identify additional taxa, indicated by a plateau. Different colors represent different samples. (c) Box plots depict differences in bacterial diversity between the N and T groups according to the Shannon index. (d) PCA at the OTU level. (e) Partial least square discriminant score plot of oral microbiota between the N and T groups. N, clinical normal samples; T, oral cancer samples.

