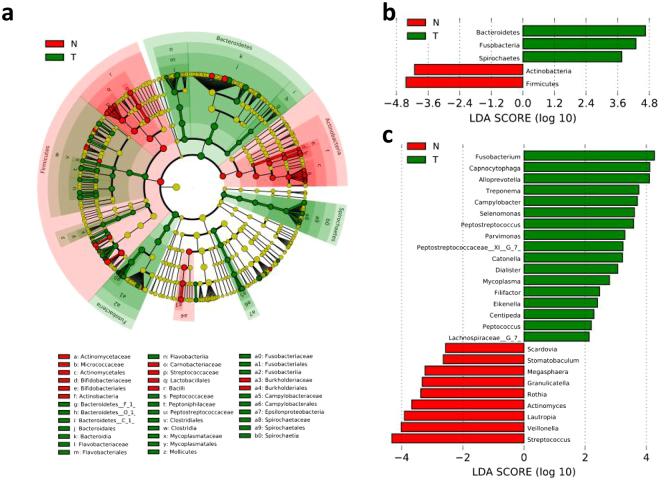
Figure 3.
Distinct taxa identified in the N and T groups using LEfSe analysis. (a) Cladogram constructed using the LEfSe method to indicate the phylogenetic distribution of bacteria that were remarkably enriched in the N and T groups. (b) LDA scores showed significant bacterial differences within groups at the phylum level.(c) LDA scores showed significant bacterial differences within groups at the genus level. N, clinical normal samples; T, oral cancer samples.

