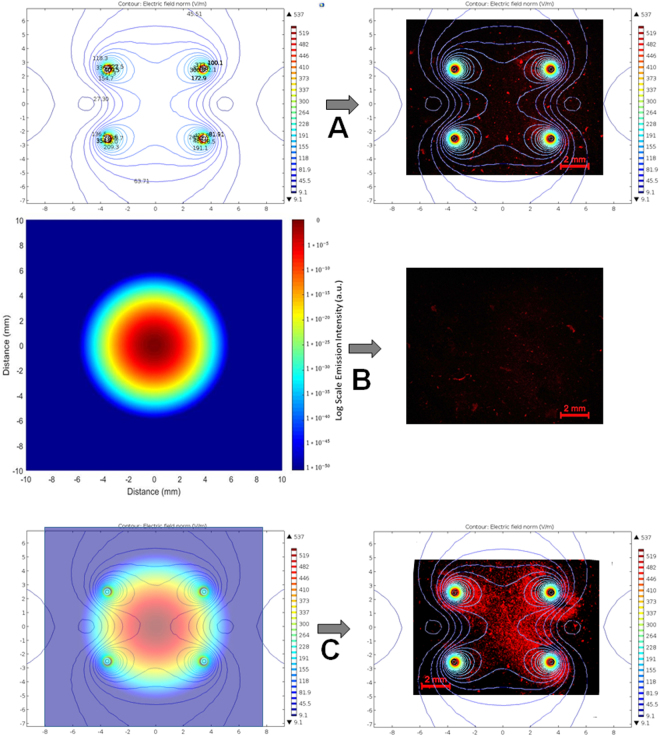
Figure 3.
A complementation between electric field distribution and laser beam profile for MHIRE tumor treatment. (A) Electric field distribution (left) of a 5 × 7 mm four-needle electrode with 525 V applied between the anode and cathode (corresponding to 750 V/cm), and the electric field-only in vitro result (right); (B) Normalized laser beam profile in log scale (left) and the corresponding heating-only result (right); (C) Combination of the electric field and the laser beam profile (left) and the significantly improved, more uniformly treated outcome. Both the electric field distribution and laser beam Gaussian profiling were from computational results using Comsol Multiphyics and Matlab softwares. The electric field is strongest around the needles, which surround the tumor. The intensity of the laser is highest at the center, resulting in a higher temperature in the center of the tumor. A 3D agarose gel Pan02 tumor model was used for the in vitro study. Area with red color was zone of dead cells indicated by Propidium Iodide (PI) staining.

