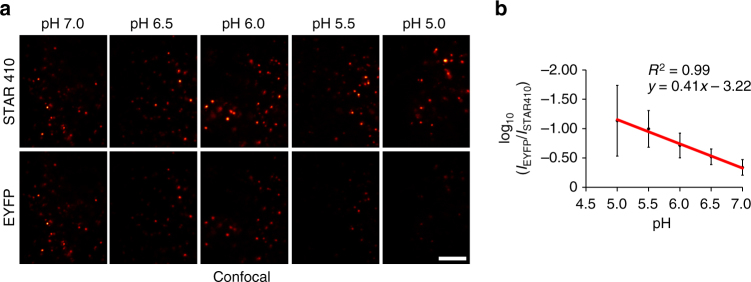
Fig. 4.
SRpHi probes respond to pH changes in vivo. a MEF cells pulsed with SRpHi1 for 10 min were equilibrated to the indicated pH by application of an external citric acid/phosphate buffer supplemented with 140 mM KCl and 1 µM nigericin. Cells were imaged in confocal mode. EYFP images have been normalized to the corresponding STAR410 image for visualization. Scale bar: 5 µm. b Cells were imaged as in a with STED. A mask of all endosomes was created and the ratio of EYFP/STAR410 signal was calculated for each endosome (n > 150 endosomes for each pH value), averaged for each pH value, and their log10 value plotted. Error bars represent standard deviation from the mean. Log10 EYFP/STAR410 values were fit to a linear equation (R 2 = 0.99)

