Fig. 4.

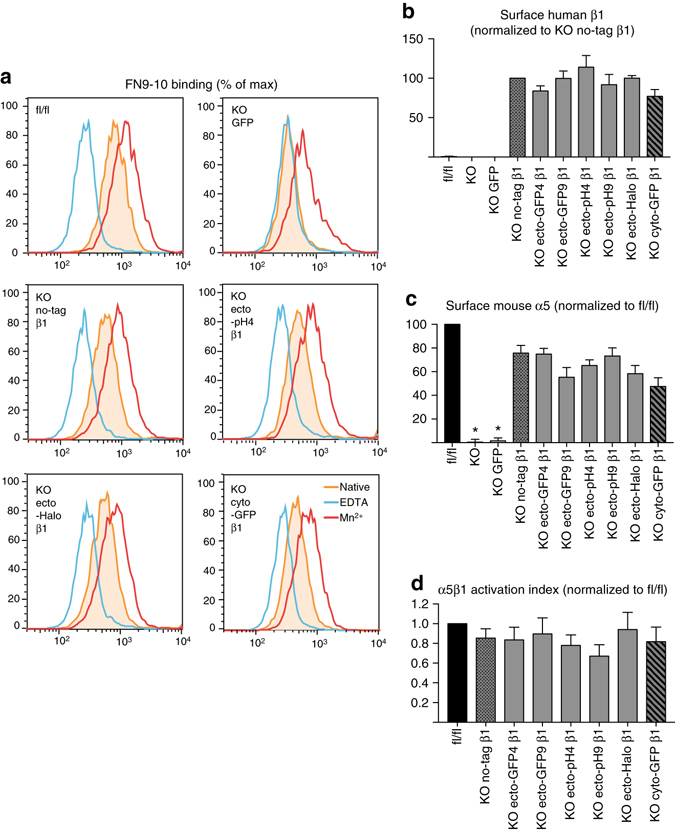
Ecto-tagged β1 integrins bind soluble ligand, restore surface levels of endogenous α5 integrins, and display normal activation indices. a Flow cytometry histograms showing binding of soluble FN9-10 to parental and a subset of reconstituted KO fibroblasts, in native conditions (filled orange peak), EDTA-inhibited conditions (blue peak), or Mn2 + -treated conditions (red peak). Full data set in Supplementary Fig. 3a. b, c Quantification of surface levels of human β1 (b) and mouse α5 integrins (c) measured by flow cytometry on parental and reconstituted β1 integrin fl/fl and KO fibroblasts. d Activation index of surface α5β1 integrins on parental and reconstituted β1 integrin fl/fl and KO fibroblasts, calculated as (FN9-10 binding in native conditions—FN9-10 binding in EDTA-inhibited conditions)/surface levels of α5 integrins. All data b–d is shown as mean ± SEM from four independent experiments. Statistical analysis was performed using one-way repeated measures ANOVA with Dunnett post hoc test. Each column was compared to KO no-tag β1 and *p < 0.05
