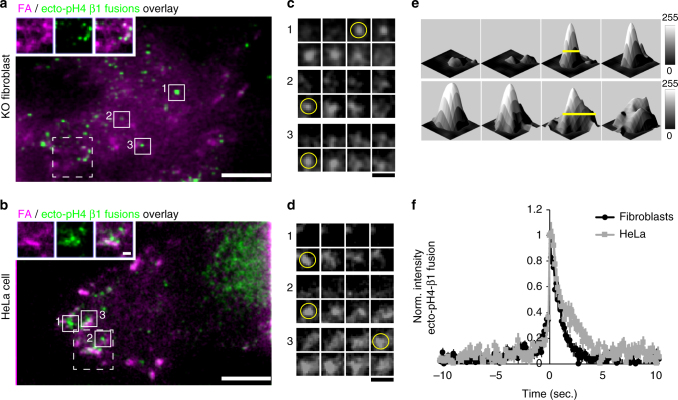
Fig. 5.
Visualization of ecto-pHluorin-β1 integrin exocytosis in live cells by TIRFM. a, b Overlay images of ecto-pH4 β1 integrins prior to photobleaching to mark the footprint of FA (magenta) in KO fibroblasts reconstituted with ecto-pH4 β1 integrin (a) or HeLa cells overexpressing ecto-pH4 β1 integrin (b), and, the maximum projection of ecto-pH4 β1 integrin fusion events after photobleaching (fusions, green label; Supplementary Movies 1 and 2). Scale bar, 10 µm. Top left corner insets show fusion events (green) in close proximity to FA (magenta) (a, b; dashed line square). Scale bar, 2 µm. c, d, Galleries of single ecto-pH4 β1 integrin fusion events over time (solid squares on a, b; 0.25 s between images). Yellow circle denotes event in which the vesicle signal intensity of the ecto-pH4 β1 integrin fluorescence rapidly intensifies, likely due to de-acidification upon opening of the fusion pore. Scale bar, 2.5 µm. e Surface plot analysis of a fusion event showing the increase on the full-width half maximum (FWHM) of the signal peak over time, consistent with bona fide full vesicle fusion (yellow lines; 0.25 s between plots). f Temporal alignment of fusion events detected on reconstituted KO fibroblasts (black line) or HeLa cells (gray line) cells showed the expected changes in ecto-pH4 β1 integrin during fusion. Data are shown as mean ± SEM for 67 and 44 events, respectively (2 cells for each)

