Fig. 6.
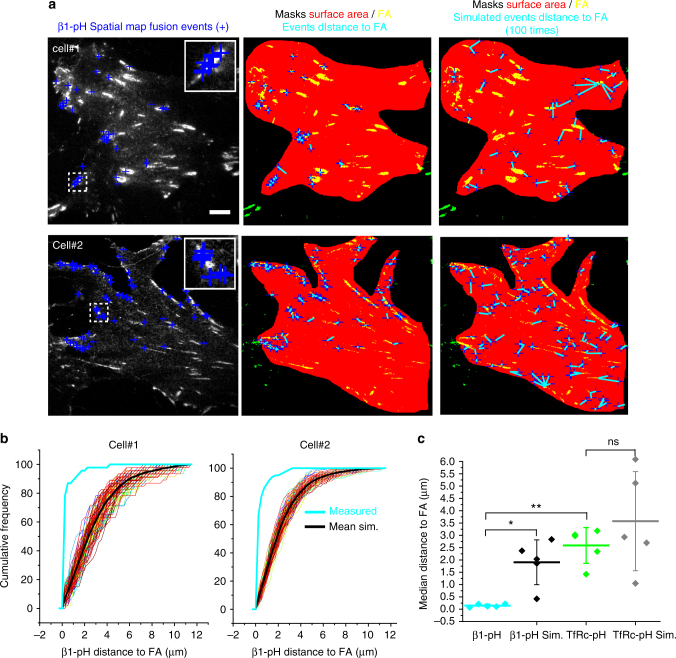
Spatial distribution analysis of ecto-pH4 β1 integrin fusion events supports direct integrin delivery to FAs. a Left panel, Distribution of fusion events (blue crosses) and FAs (white) detected by TIRFM in two KO fibroblasts reconstituted with ecto-pH4 β1 integrins (β1-pH). Center panel, the distance of fusion events to the nearest FA (yellow mask) was measured (cyan lines). Right panel, the distance of randomly simulated events around the cell surface (red mask) to the nearest FA were measured (cyan lines). Scale bar, 10 µm. b Cumulative frequency charts for the two cells demonstrating the difference in distance to FA between the measured data (cyan line) and 100 simulations (individual simulation, color lines; mean, black line). c Quantification of the median distance to FAs for β1-pH or TfRc-pH fusion events, and the simulations (β1-pH Sim and TfRc-pH Sim) performed in the same cells. The scatter-box graph shows the mean ± SD for 5 cells and the respective simulation data. Statistical analysis was performed using a two samples Student’s t-test. *p < 0.05, **p < 0.01

