Fig. 7.
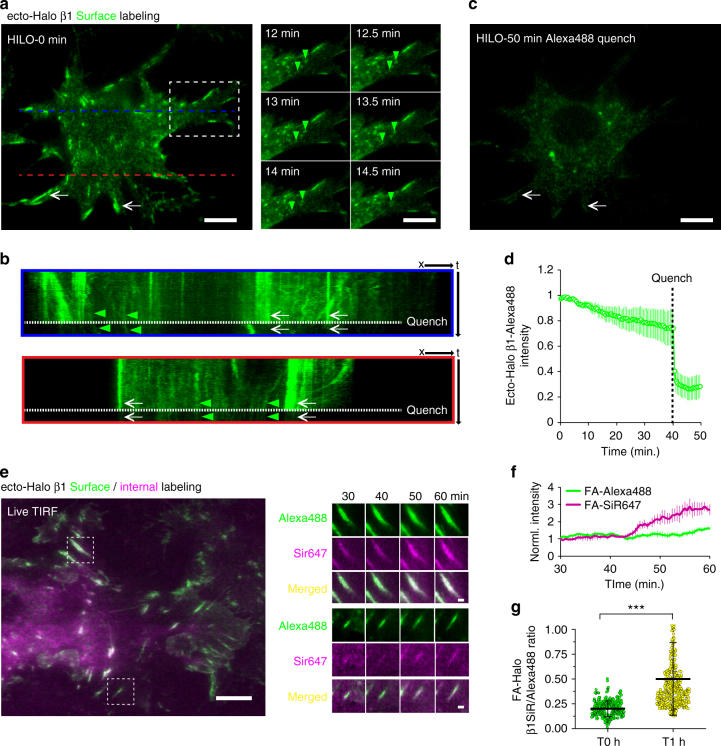
Selective surface and internal labeling of ecto-Halo β1 integrins demonstrates integrin endocytosis in live cells. a Labeling of surface ecto-Halo β1 integrins in reconstituted KO fibroblasts with Alexa488 Halo ligand and imaging by HILO TIRFM immediately after labeling (0 min). Scale bar, 15 µm. Right panel, movement of Alexa488-positive vesicle-like structures (dashed line rectangle, green arrowheads). Scale bar, 10 µm. b Kymograph of two regions of the cell (blue and red lines) illustrating the dynamics of Alexa488-positive structures before (green arrowheads) and after the addition of Alexa488 quencher antibody (white arrows). c Residual Alexa488 signal after quenching, imaged by HILO TIRFM 50 min post labeling (white arrows). Scale bar, 15 µm. d quantification of normalized ecto-Halo β1 Alexa488 intensity before and after quenching. The line graph shows the mean ± SD of the normalized intensity for 5 cells. e Overlay image of KO fibroblasts reconstituted with ecto-Halo β1 integrins, after sequential labeling with Alexa488 and SiR647 Halo ligands and imaged by TIRFM. Scale bar, 15 µm. Images on the right show the time series of two FAs (dashed line square). Scale bar, 2.5 µm. f Line graph showing the temporal changes in SiR647 and Alexa488 Halo signals in FAs measured by TIRFM during a 30 min period (mean ± SD for 4 FAs). g Scatter-box graph showing the mean ± SD for the ratio of SiR647/Alexa488 Halo signals of 388 and 523 FAs imaged by TIRFM 0 h or 1 h after incubation at 37 °C on fixed samples (6 cells per conditions). Statistical analysis was performed using a two samples Student’s t-test and ***p < 0.001

