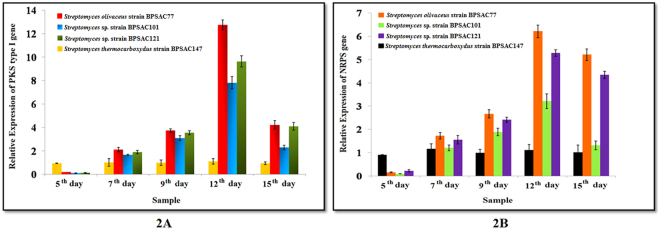
Figure 2.
Relative gene expression of PKS type I gene and NRPS gene on five alternate days across strains BPSAC77, BPSAC101, BPSAC121 and BPSAC147. The expression level calculated by the formula 2−ΔΔCt represents the x-fold difference from the calibrator and 16S rRNA gene as endogenous control. Threshold cycle (CT) was compared with log10 relative copy number of the sample from a dilution series. Error bars indicate standard error. Sample after 12th day of incubation shows highest expression level.

