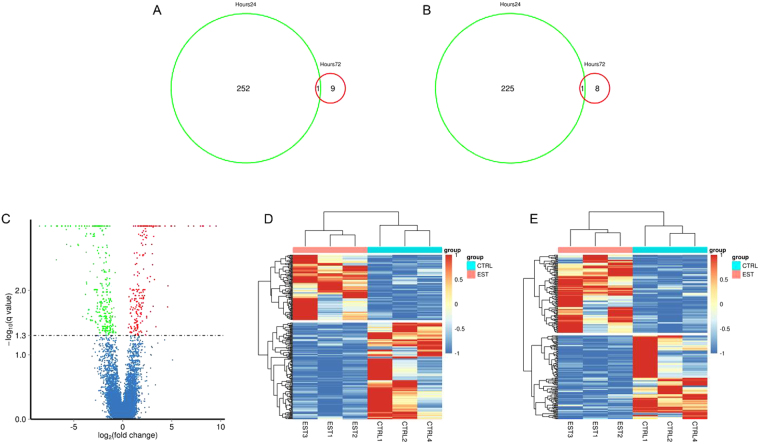
Figure 1.
The number of differentially expressed genes in rainbow trout treated with estradiol (E2). (A) Venn diagram of common differentially expressed mRNA in E2 treated fish between 2 time points (24 hours post-injection versus 72 hours post-injection). (B) Venn diagram of common differentially expressed lncRNA in E2 treated fish between 2 time points. (C) A volcano plot of differentially expressed transcripts (lncRNAs and mRNAs) between control and E2 treated group. (D–E) Unsupervised hierarchical clustering of the expression profiles of differentially expressed mRNAs (D) and lncRNAs (E) both distinguish E2 treated and control group. Up- and down-regulated genes are indicated respectively by red and blue colors.

