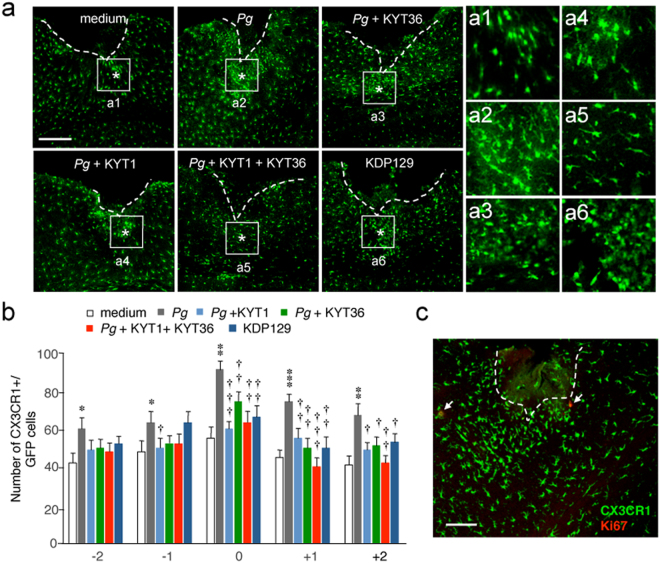
Figure 1.
Infection of the CX3CR1+/GFP mouse brain with P. gingivalis promotes microglial migration through gingipains. (a) CLSM images of the CX3CR1-positive cells accumulated around the injection site (asterisks) of the somatosensory cortex at 24 h after infection. Pg: P. gingivalis. Boxes indicate the 300 × 300 μm squares placed for the cell counting. Scale bar, 300 μm. Asterisks indicate the injection sites (0). a1–a6: Higher-power micrographs showing most CX3CR1-positive cells that accumulated around the injected sites had a process-bearing morphology. (b) The quantitative analyses of CX3CR1-positive cells accumulated around the injection site. The numbers (-2, -1, 0, 1 and 2) represent subsequent slices with reference to the injection site (0). The results represent the mean ± SEM of three independent experiments. A one-way ANOVA with post hoc Tukey’s test; p value of medium vs. Pg, Pg vs. Pg + KYT1, Pg vs. Pg + KYT36, Pg vs. Pg + KYT1 + KYT36, Pg vs. KDP129 were as follows: -2 group: *p = 0.0133, p = 0.1140, p = 0.1713, p = 0.0748, p = 0.3583. -1 group: *p = 0.0323, †p = 0.0428, p = 0.1941, p = 0.1941, p = 0.9999. 0 group: **p = 0.012, †††p = 0.0009, ††p = 0.0091, ††p = 0.0022, ††p = 0.0036. + 1 group: ***p = 0.0001, ††p = 0.0068, ††p = 0.0029, †††p = 0.0006, ††p = 0.0032. + 2 group: **p = 0.0038, †p = 0.0124, †p = 0.0194, ††p = 0.0039, †p = 0.0327. (c) Immunofluorescent CLSM images of CX3CR1-positive cells devoid of Ki67 immunoreactivity. Scale bar, 100 μm.

