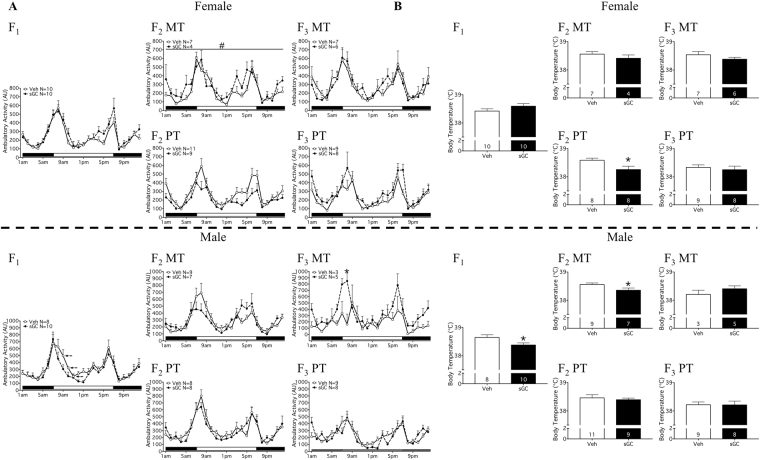
Figure 5.
(A) Locomotor activity and (B) average body temperature over 24-hour period in the animal’s home cage for F1-F3 female and male MT (Maternal Transmission) and PT (Paternal Transmission) offspring. Veh (Vehicle) open symbols/bars, sGC (synthetic glucocorticoid) closed symbols/bars. (A) X-axis: solid bar indicates lights off, open bar indicates lights on. Data are expressed as mean ± SEM. A significant difference between Veh and sGC groups is represented as follows: *P < 0.05; #P = 0.068. A significant 1-hour phase difference between Veh and Beta groups is represented as follows:  P < 0.05.

