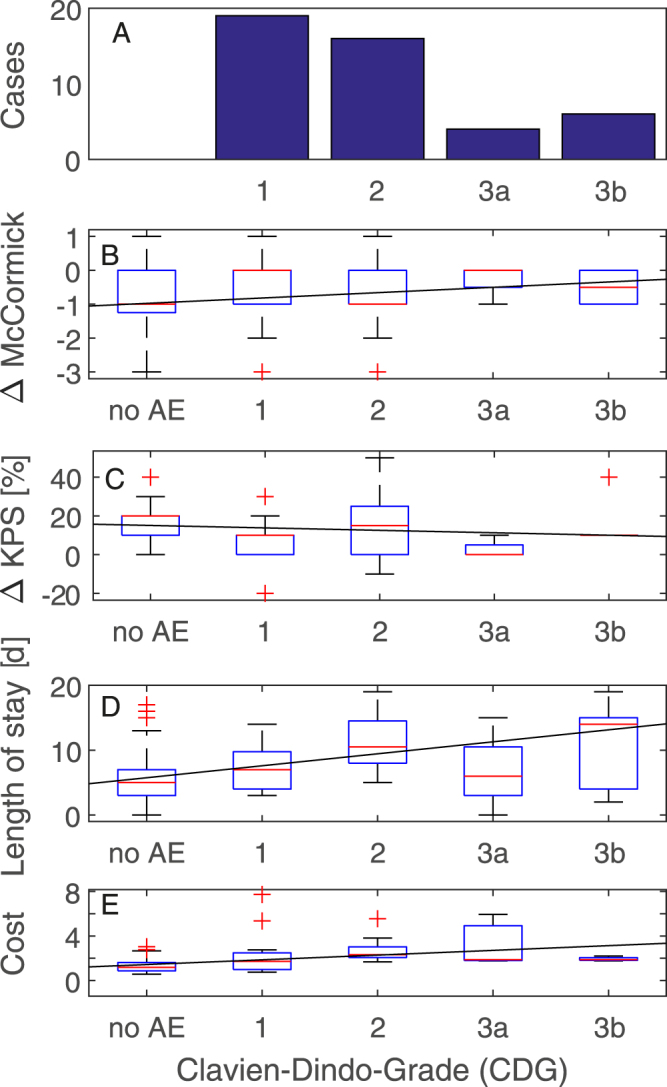
Figure 1.

Effect of the severity of complication noted at discharge or at 6 week follow-up. (A) Distribution of the 45 complications registered up to the first 6 weeks after discharge. (B) McCormick Grade. Lines are linear least square fits (rho = 0.24, p = 0.005, 0.16 McCormick points per increment of CDG). (C) Karnofsky Performance Status Scale (KPS, rho = −0.19, p = 0.025, −1.3 KPS points per increment of CDG). (D) Length of stay in hospital (rho = 0.40, p < 0.001, 1.8 days per increment of CDG). (E) Relative costs of treatment and treatment cost (rho = 0.45, p < 0.001, 0.4 cost units per increment of CDG).
