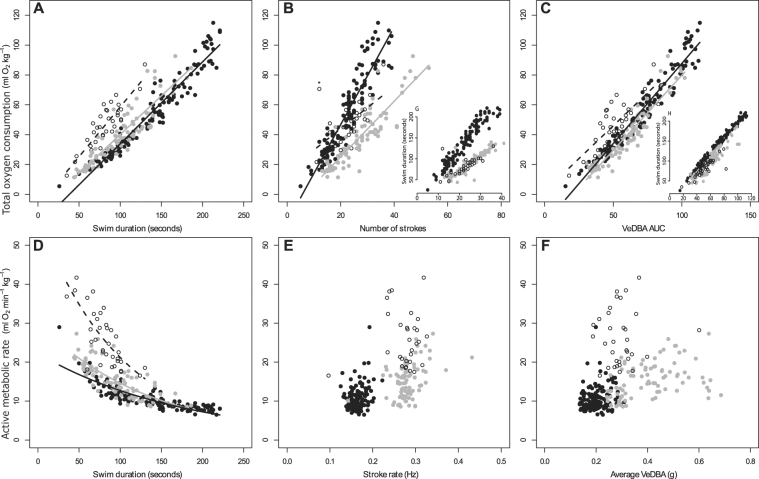
Figure 2.
Relationship between total oxygen consumption (ml kg−1; top panel) and swim duration (A), number of strokes (B) and VeDBA AUC (C) and relationship between diving metabolic rate ( ml min−1 kg−1; bottom panel) and swim duration (D), stroke rate (E) and average VeDBA (F). The relationship between swim duration and of total number of strokes (G) and VeDBA AUC (H) are displayed for comparative purposes. Open circles are small females and subadults (N = 4 animals; n = 47 trials), closed grey circles are males (N = 5 animals; n = 86) and closed black circles are large females (N = 4 animals; n = 130 trials). For comparisons with other papers the average VeDBA used in F has a running mean of 2 seconds and no threshold11,36. *Represents an outlier that was removed when fitting the regression.

