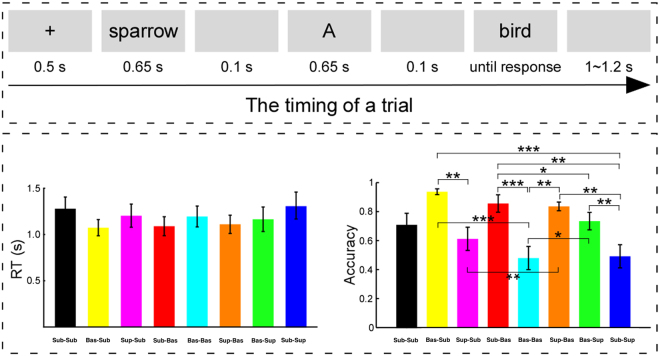
Figure 1.
Experimental procedure of the categorisation reasoning task and behavioural performance. Top: A representative sequence and the detailed timing of one trial. Note that the illustration depicted a subordinate-basic categorisation. Moreover, ‘sparrow’ was a typical representation of ‘bird’. Bottom left: The mean RT in the conclusion items. It was notable that RT results did not reveal significant difference among the subordinate-subordinate, basic-subordinate, superordinate-subordinate, subordinate-basic, basic-basic, superordinate-basic, basic-superordinate, and subordinate-superordinate categorizations, p > 0.05 (one-way repeated-measures ANOVA). Bottom right: The accuracy of positive judgment in the conclusion items. The results revealed significant difference among the eight categorizations, p < 0.001 (one-way repeated-measures ANOVA). Note: In the bottom panel, *p < 0.05, **p < 0.01, and p < 0.001, respectively, N = 19. RT is response time; For each trial type, error bars represent ± SEM across all participants.

